Live.monitor_system()
DVCLive can track and log your system metrics so you can see your hardware performance and limitations during your experiments. The metrics concern your CPU, RAM and disk memory usage. It can also monitor your GPU usage, if you have some.
def monitor_system(
    interval: float = 0.05,
    num_samples: int = 20,
    directories_to_monitor: Optional[Dict[str, str]] = None,
    ):
Usage
To monitor your system metrics you can set the monitor_system parameter to
True in Live:
from dvclive import Live

live = Live(monitor_system=True)
or you can specify additional parameters to configure the logger behavior:
from dvclive import Live

live = Live()
live.monitor_system(
    interval = 0.01
    num_samples = 20,
    directories_to_monitor = {"data": "/data", "users": "/home"},
)
The system metrics will then be available live in DVC Studio and in our VSCode extension.
Description
The Live.monitor_system() method is used to configure how Live logs your
system metrics. If you call Live with monitor_system=True,
Live.monitor_system() will be called with default parameters.
Live will sample your system for metrics at regular intervals and average them
over a number of samples. The averaged data is then
logged as a metric.
The sampling terminates when you call
live.end().
Parameters
-
interval- the time interval between samples in seconds. To keep the sampling interval small, the maximum value allowed is 0.1 seconds. Default to 0.05. -
num_samples- the number of samples to collect before the aggregation. The value should be between 1 and 30 samples. Default to 20. -
directories_to_monitor- a dictionary with the information about which directories to monitor. Thekeywould be the name of the metric and thevalueis the path to the directory. The metric tracked concerns the partition that contains the directory. Default to{"main": "/"}.
Exceptions
ValueError- if the keys indirectories_to_monitorcontains invalid characters as defined byos.path.normpath
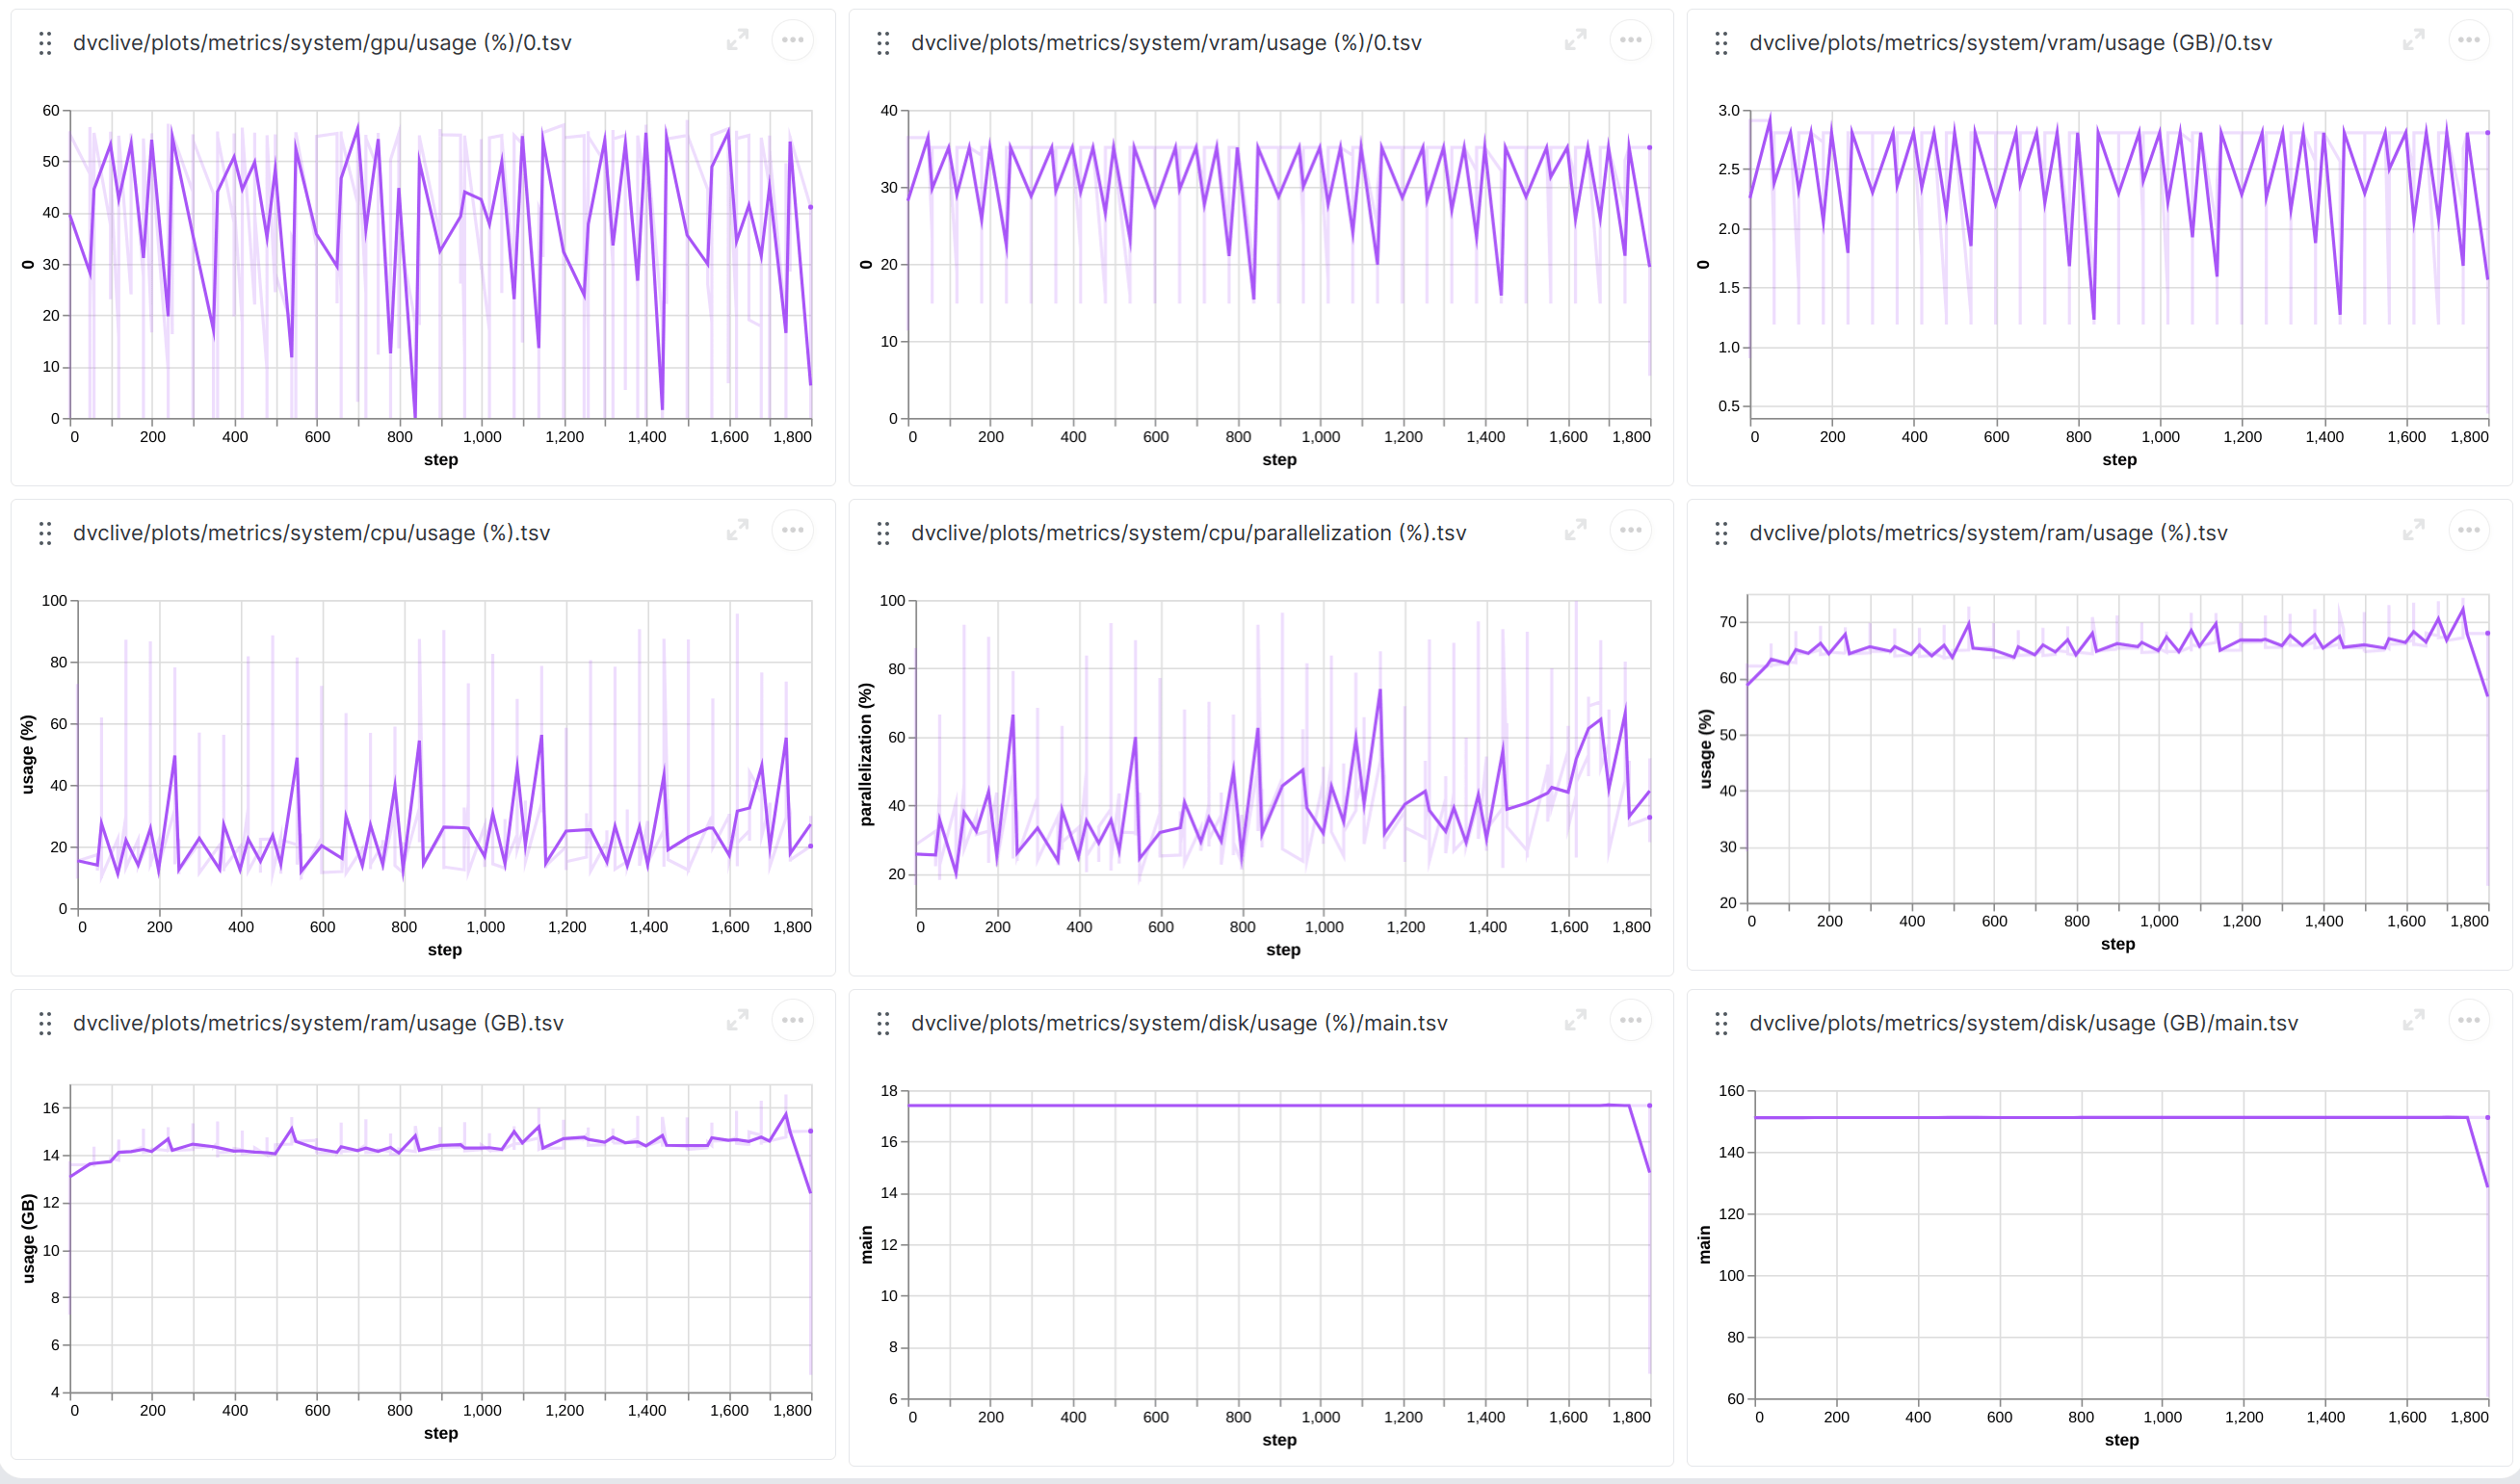
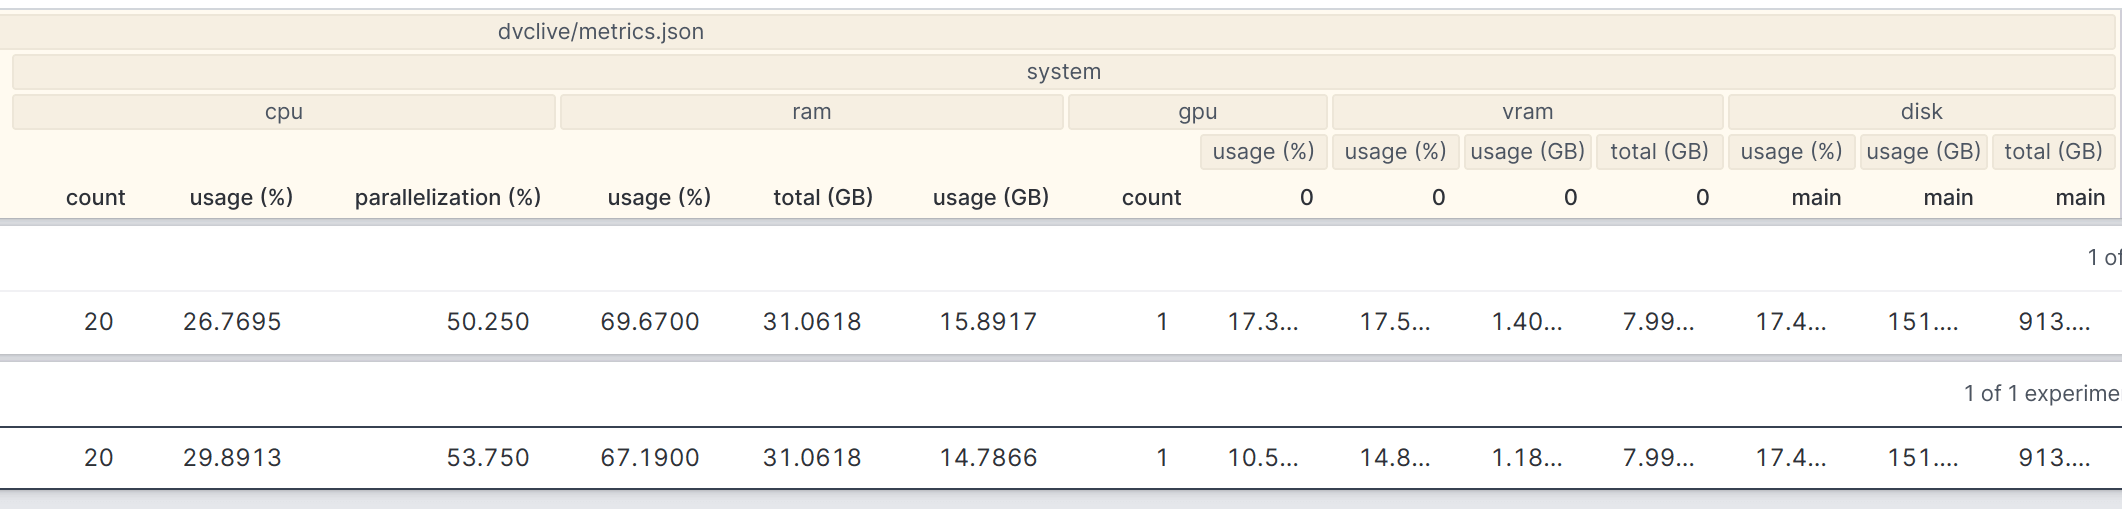
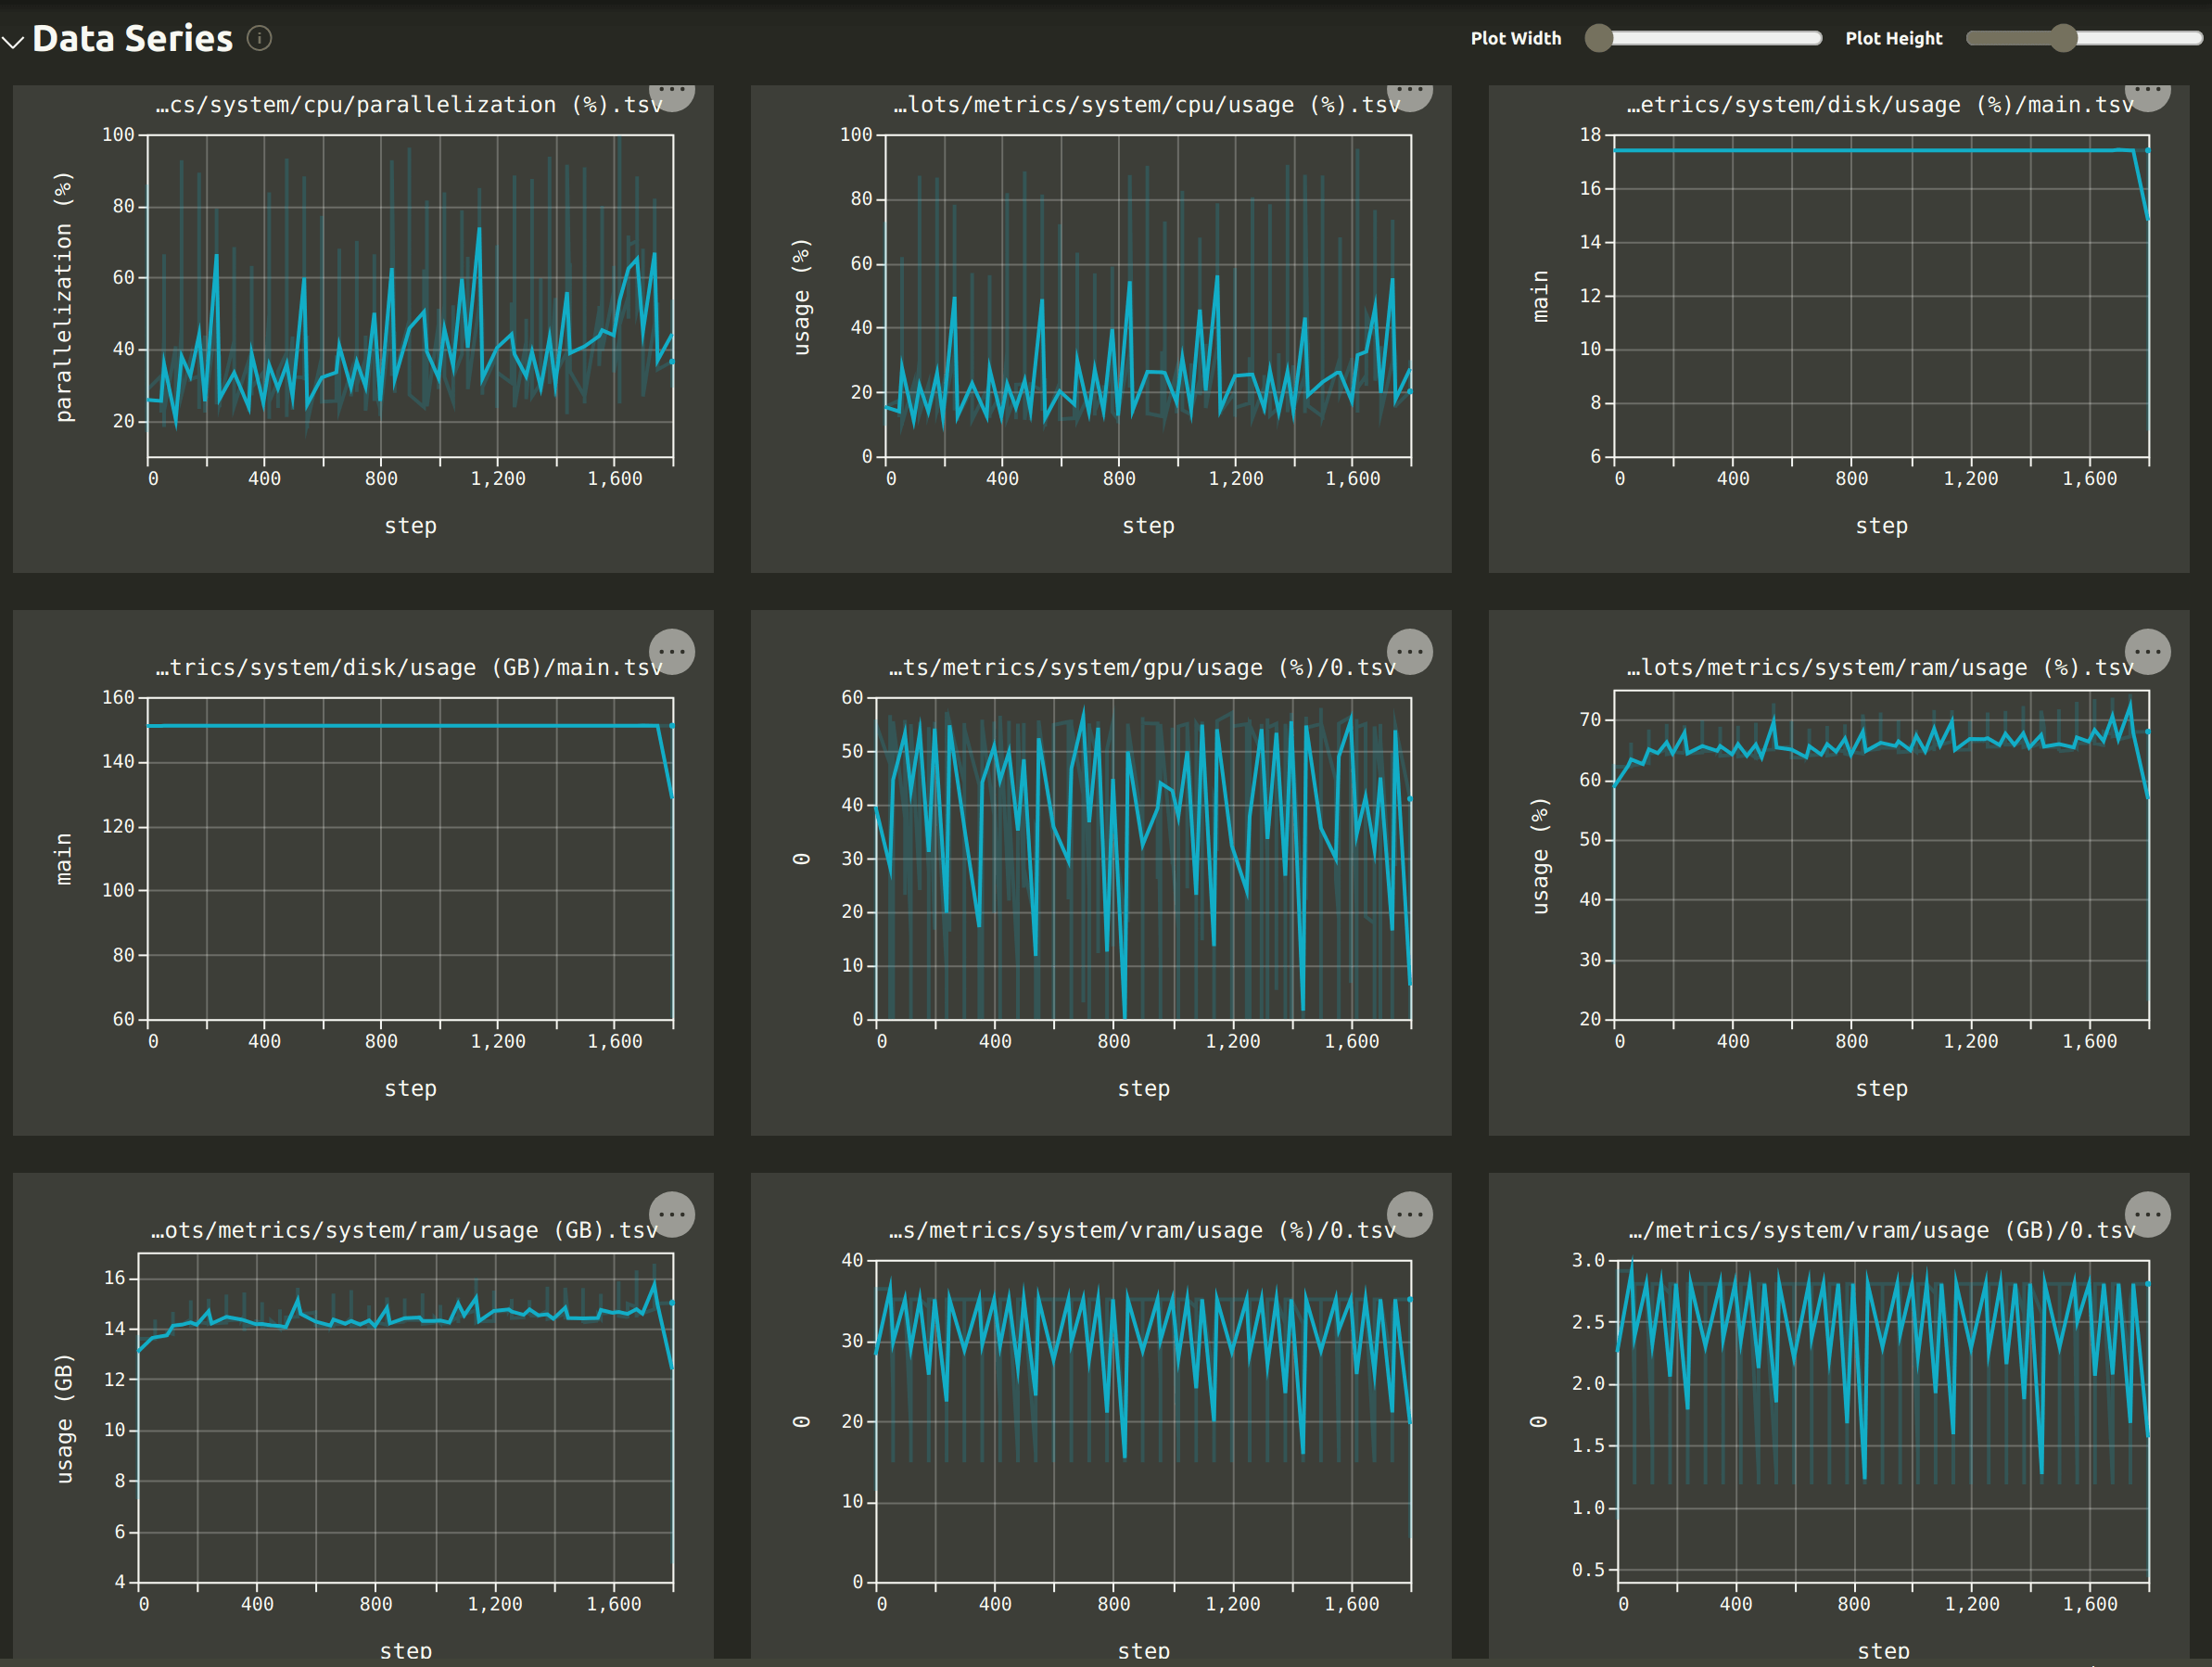
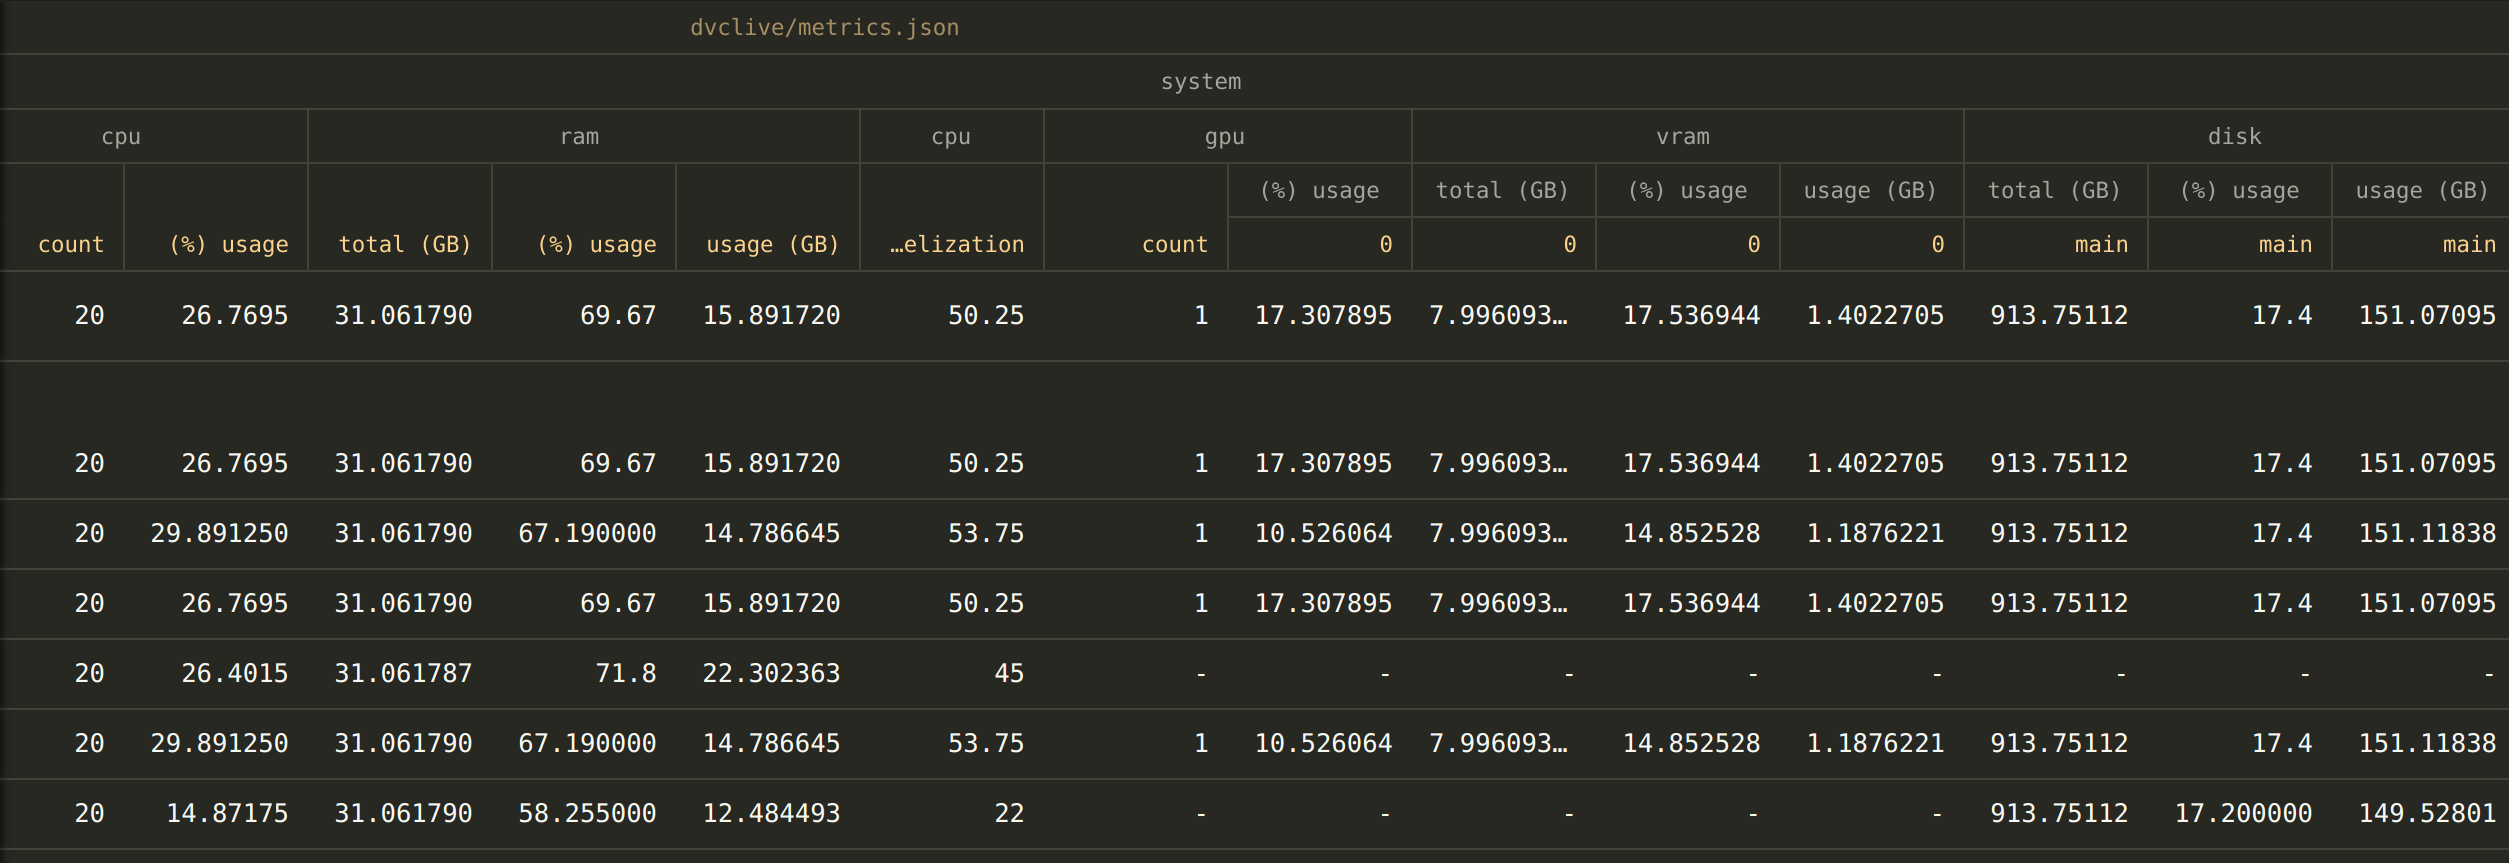
List of metrics logged
Live logs the following metrics about your system:
GPU metrics
If you have GPUs, the following metrics are logged:
system/gpu/count- the number of GPUs available. This metric is not plotted since it is not expected to change during an experiment.system/gpu/usage (%)/<gpu_index>- the average usage of the GPUs in percentage.system/vram/usage (%)/<gpu_index>- the average space used in the virtual memory of each GPU, expressed as percent of the total virtual memory available on the GPU.system/vram/usage (GB)/<gpu_index>- the average space used in the virtual memory of each GPU, expressed as gigabytes.system/vram/total (GB)/<gpu_index>- the total virtual memory available in each GPU, expressed as gigabytes.
The <gpu_index> is the index of the GPU. For example system/gpu/usage (%)/0
tracks the usage of the first GPU.
If you have a GPU on your system, but DVCLive doesn't track these metrics, please check that your GPU is supported by NVIDIA and that the NVIDIA driver is installed.
CPU metrics
system/cpu/count- the number of CPU cores available. This metric is not plotted since it is not expected to change during an experiment.system/cpu/usage (%)- the average usage of the CPUs in percentage. This metric is the average of all the CPU cores.system/cpu/parallelization (%)- the average parallelization of the system over the CPU cores. This metric is calculated as the ratio between the number of CPU cores that are used and the total number of CPU cores available. A core is considered used if its activity is greater than 20%.
RAM metrics
system/ram/usage (%)- the RAM usage in percentage of the total RAM capacities.system/ram/usage (GB)- the RAM usage in gigabytes.system/ram/total (GB)- the total RAM available in gigabytes. This metric is not plotted since it is not expected to change during an experiment.
Disk metrics
These metrics track the disk memory of your system. The directory to monitor can
be specified using the directories_to_monitor parameter. The metrics concern
the partition of the disk that contains the directory.
system/disk/usage (%)/<name>- the amount of memory used by the partition in percentage.system/disk/usage (GB)/<name>- the amount of memory used by the partition in gigabytes.system/disk/total (GB)/<name>- the total space available by the partition in gigabytes. This metric is not plotted since it is not expected to change during an experiment.
The <name> is the name of the metric that you specified in the
directories_to_monitor parameter. By default, the name is main.