Reviewing and Comparing Experiments
Once you have saved several experiments, DVC provides commands to review, compare, and manage those experiments. Let's see how they can help you streamline the experimentation process.
Show a table of experiments
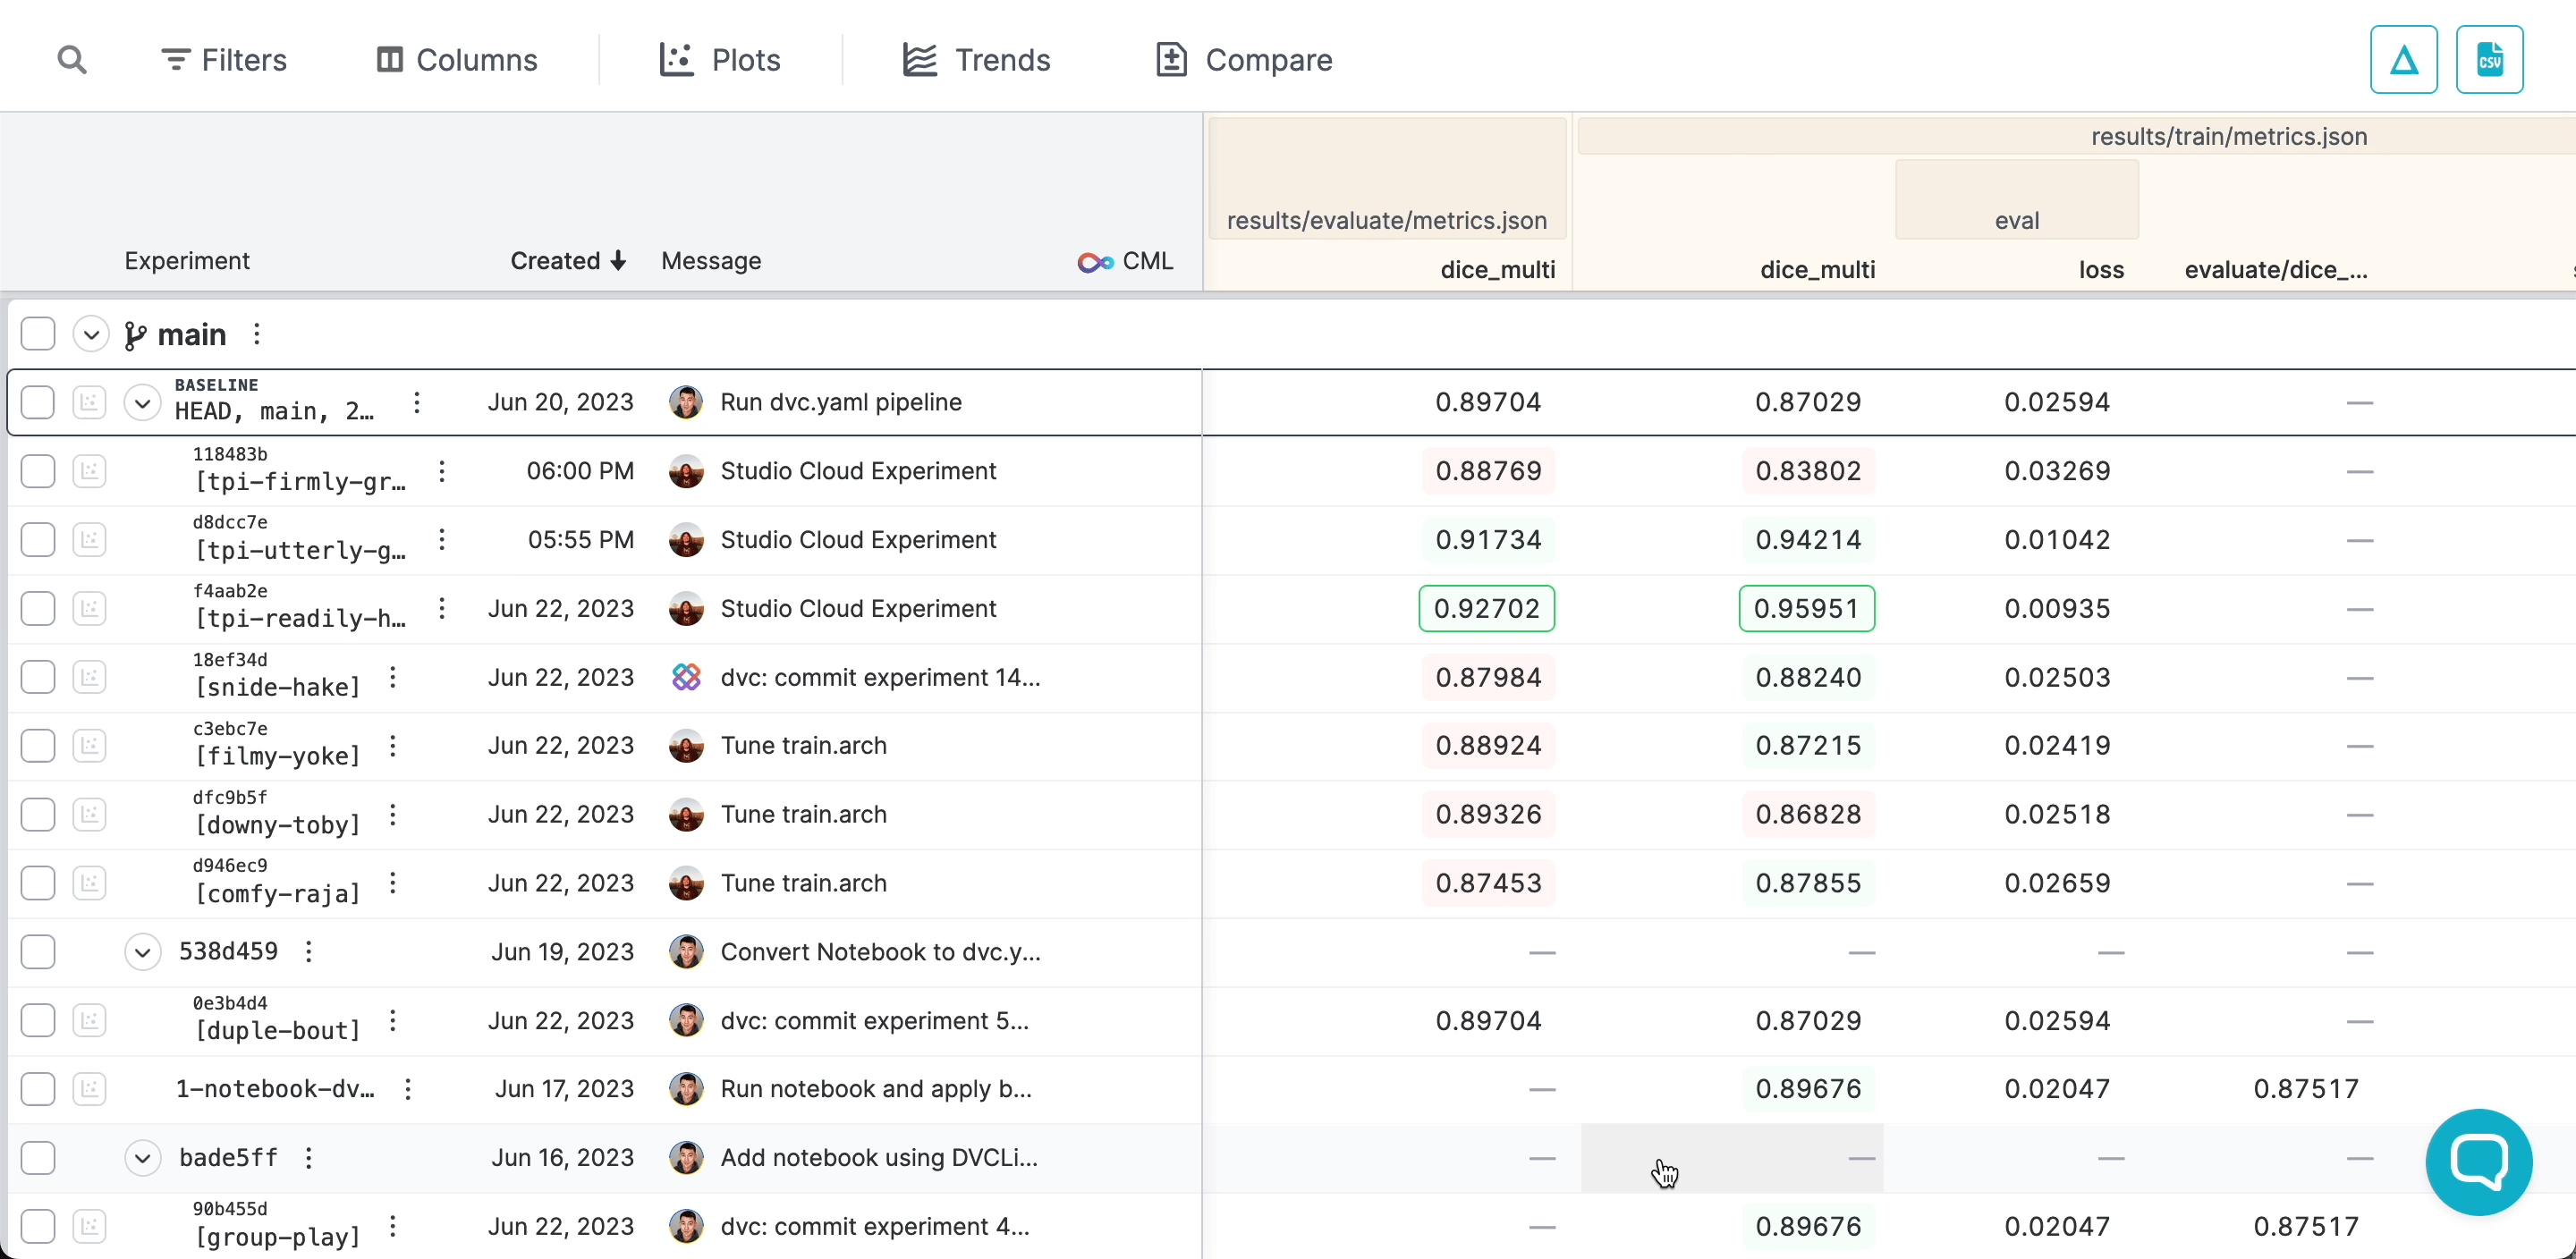
Experimentation is about generating many possibilities before selecting a few of them. You can get a table of experiments, which displays all the metrics (yellow), parameters (blue) and dependencies (violet) in a nicely formatted table.
$ dvc exp show ────────────────────────────────────────────────────────────────────────────────────────────────────────────────
Experiment Created loss acc train.epochs model.conv_units src data
────────────────────────────────────────────────────────────────────────────────────────────────────────────────
workspace - 0.03332 0.9888 10 16 695e061 6875529
baseline-experiment Jan 14, 2022 0.03332 0.9888 10 16 695e061 6875529
├── 38d6c53 [cnn-64] Jan 19, 2022 0.038246 0.988 10 64 c77a505 6875529
└── bc0faf5 [cnn-128] Jan 19, 2022 0.038325 0.989 10 128 bc75d6a 6875529
────────────────────────────────────────────────────────────────────────────────────────────────────────────────dvc exp show only tabulates experiments in the workspace and in HEAD. You
can use --all-commits (-A) flag to show all the experiments in the project
instead.
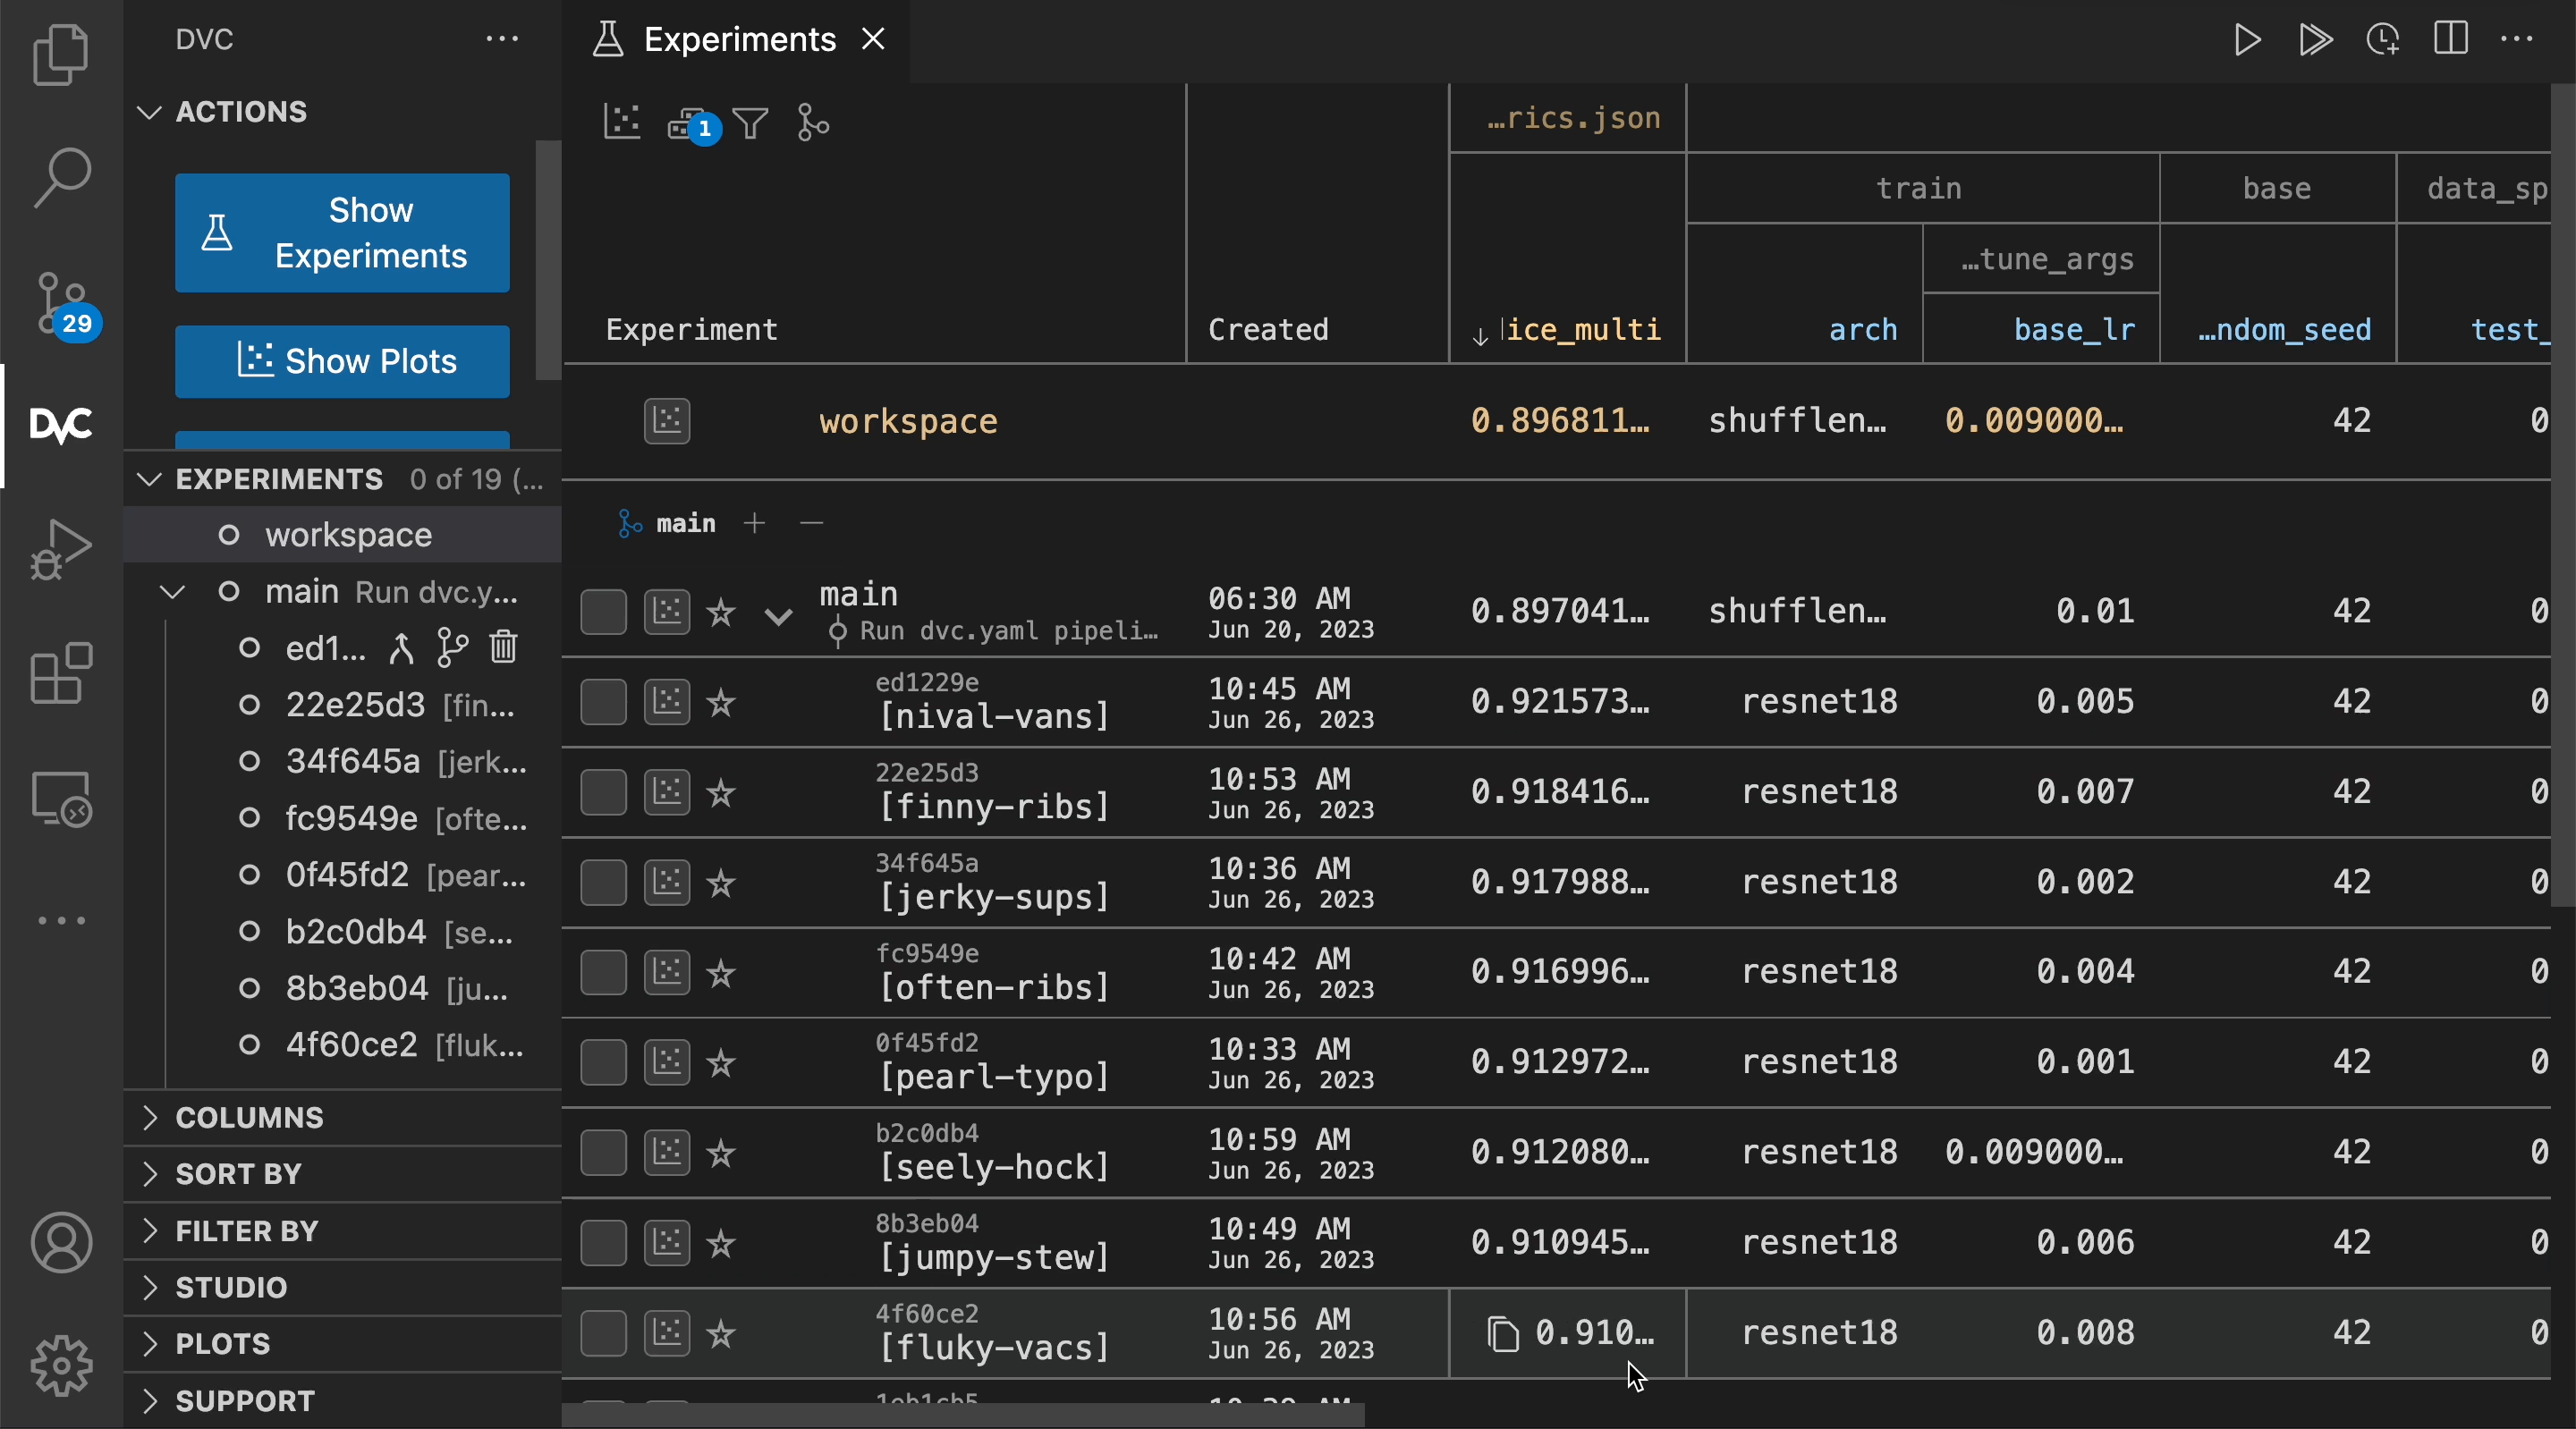
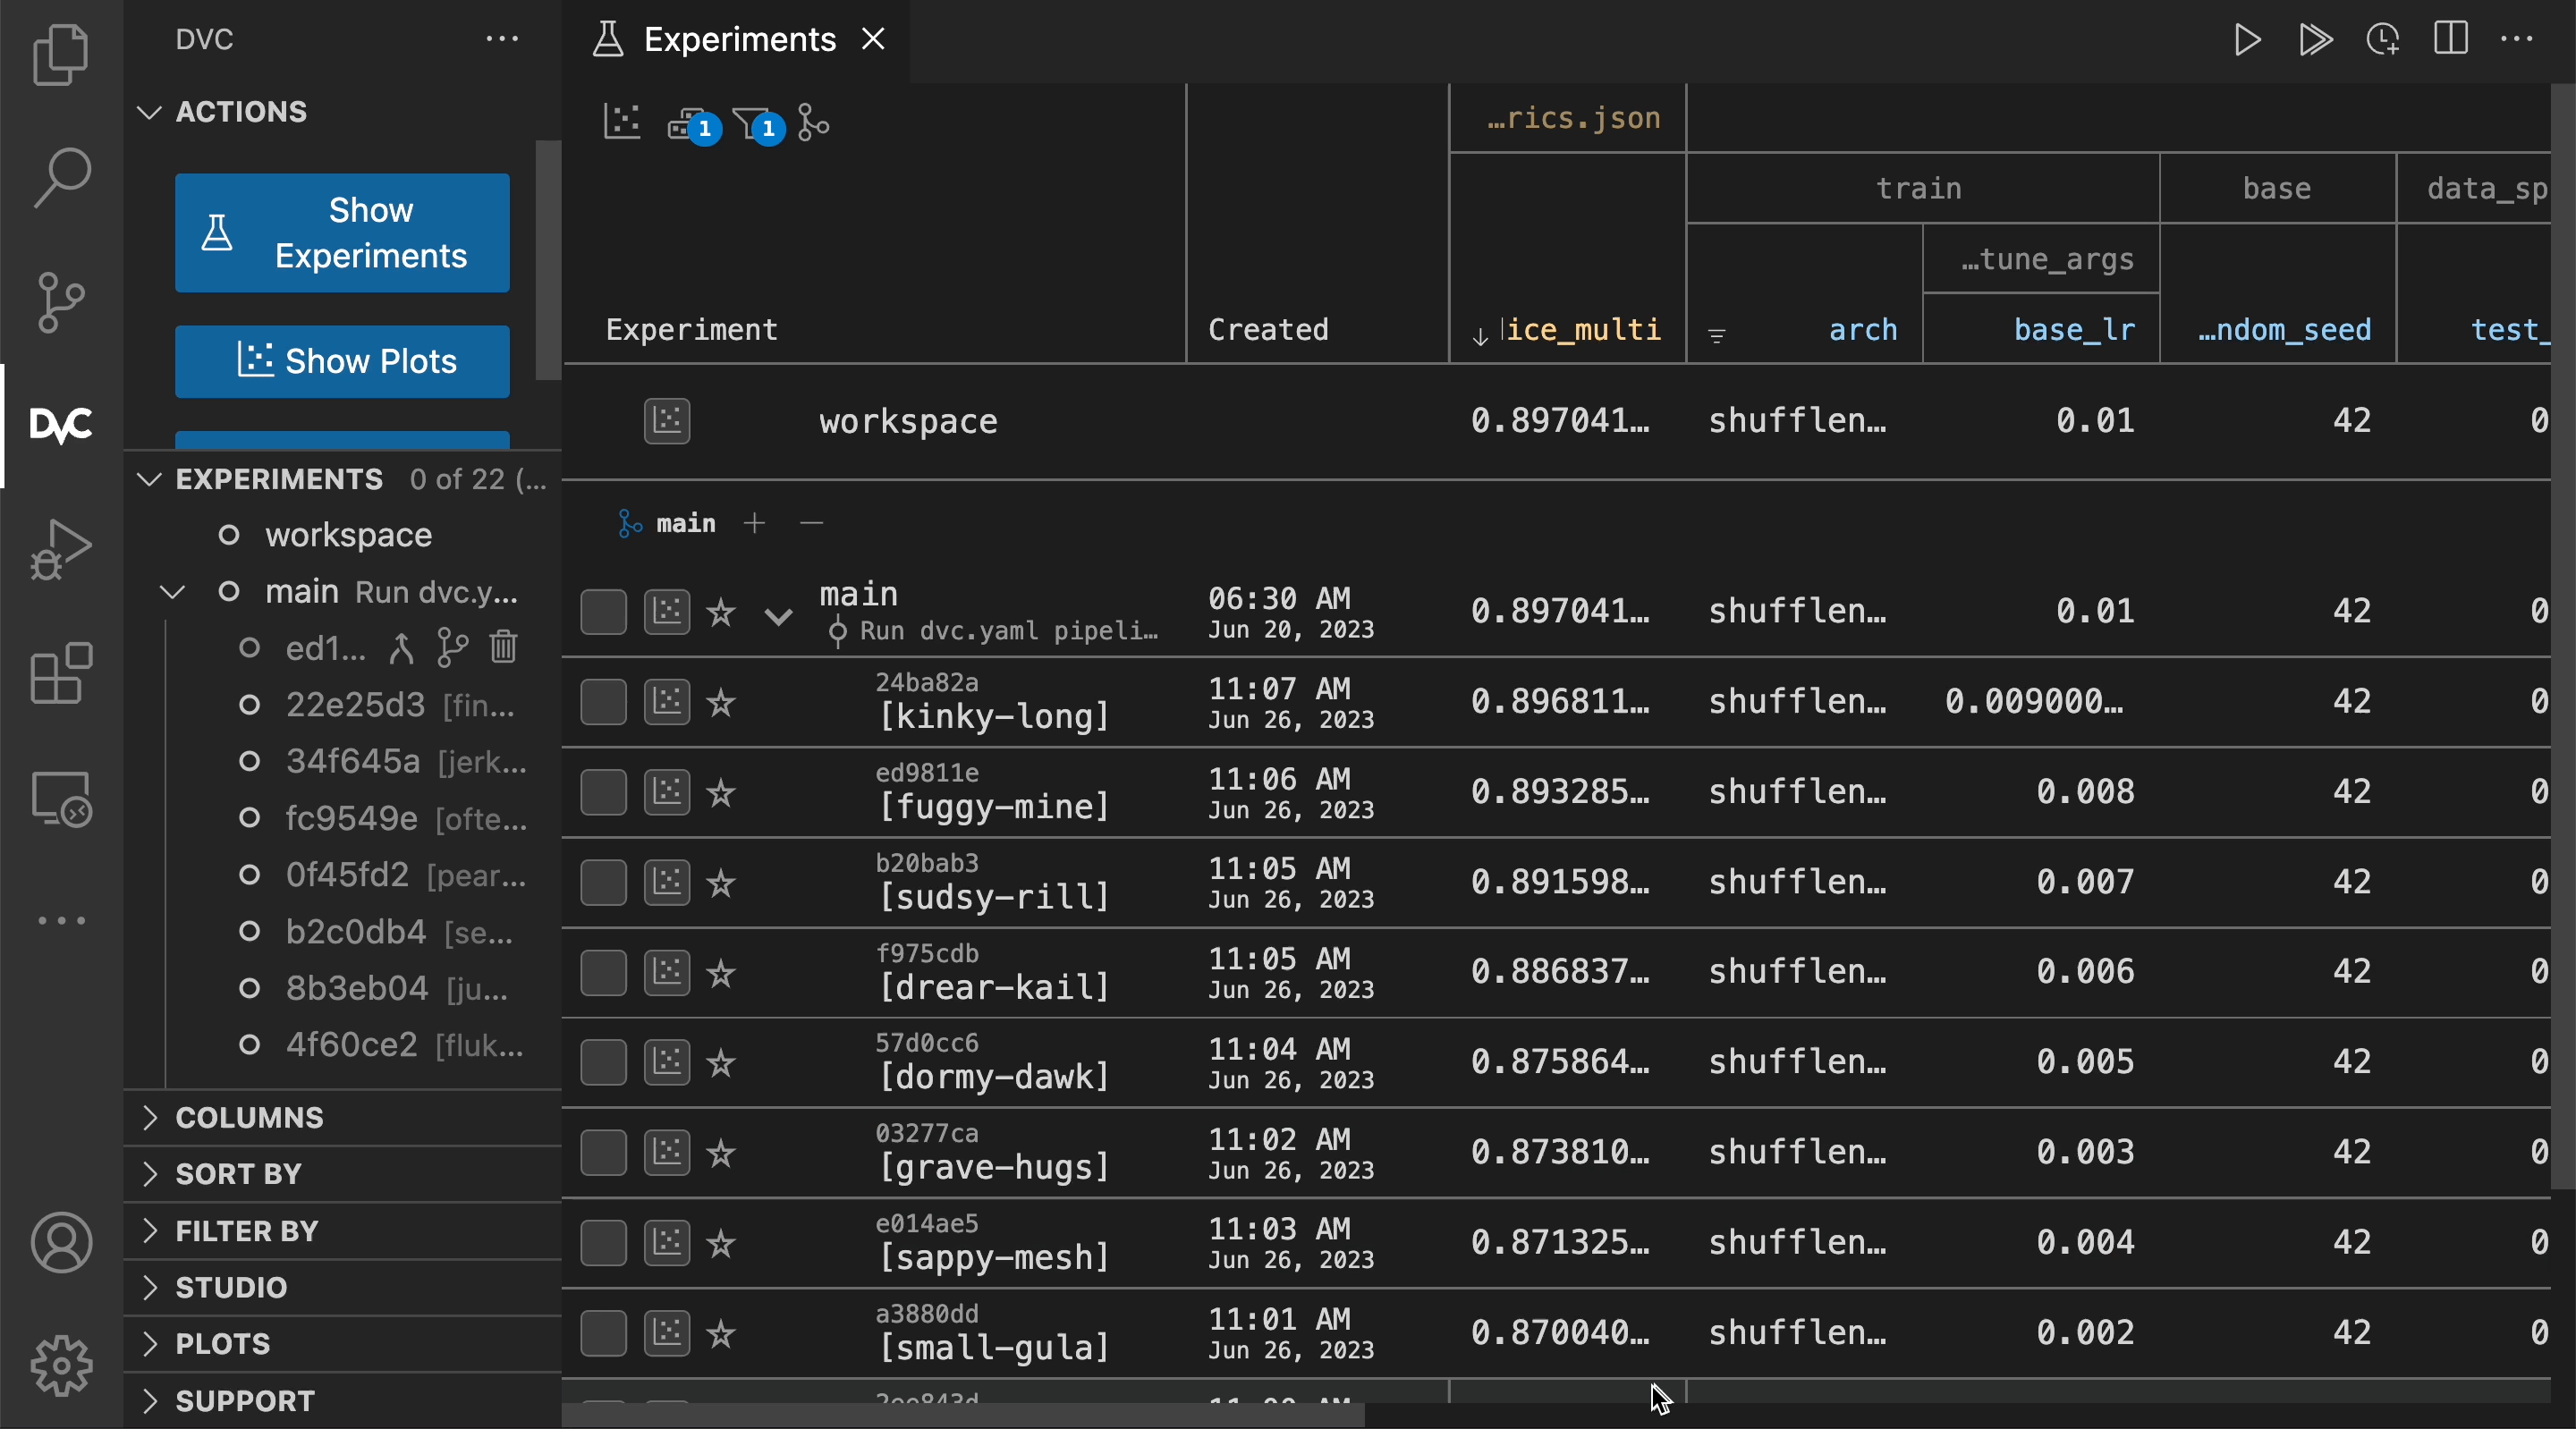
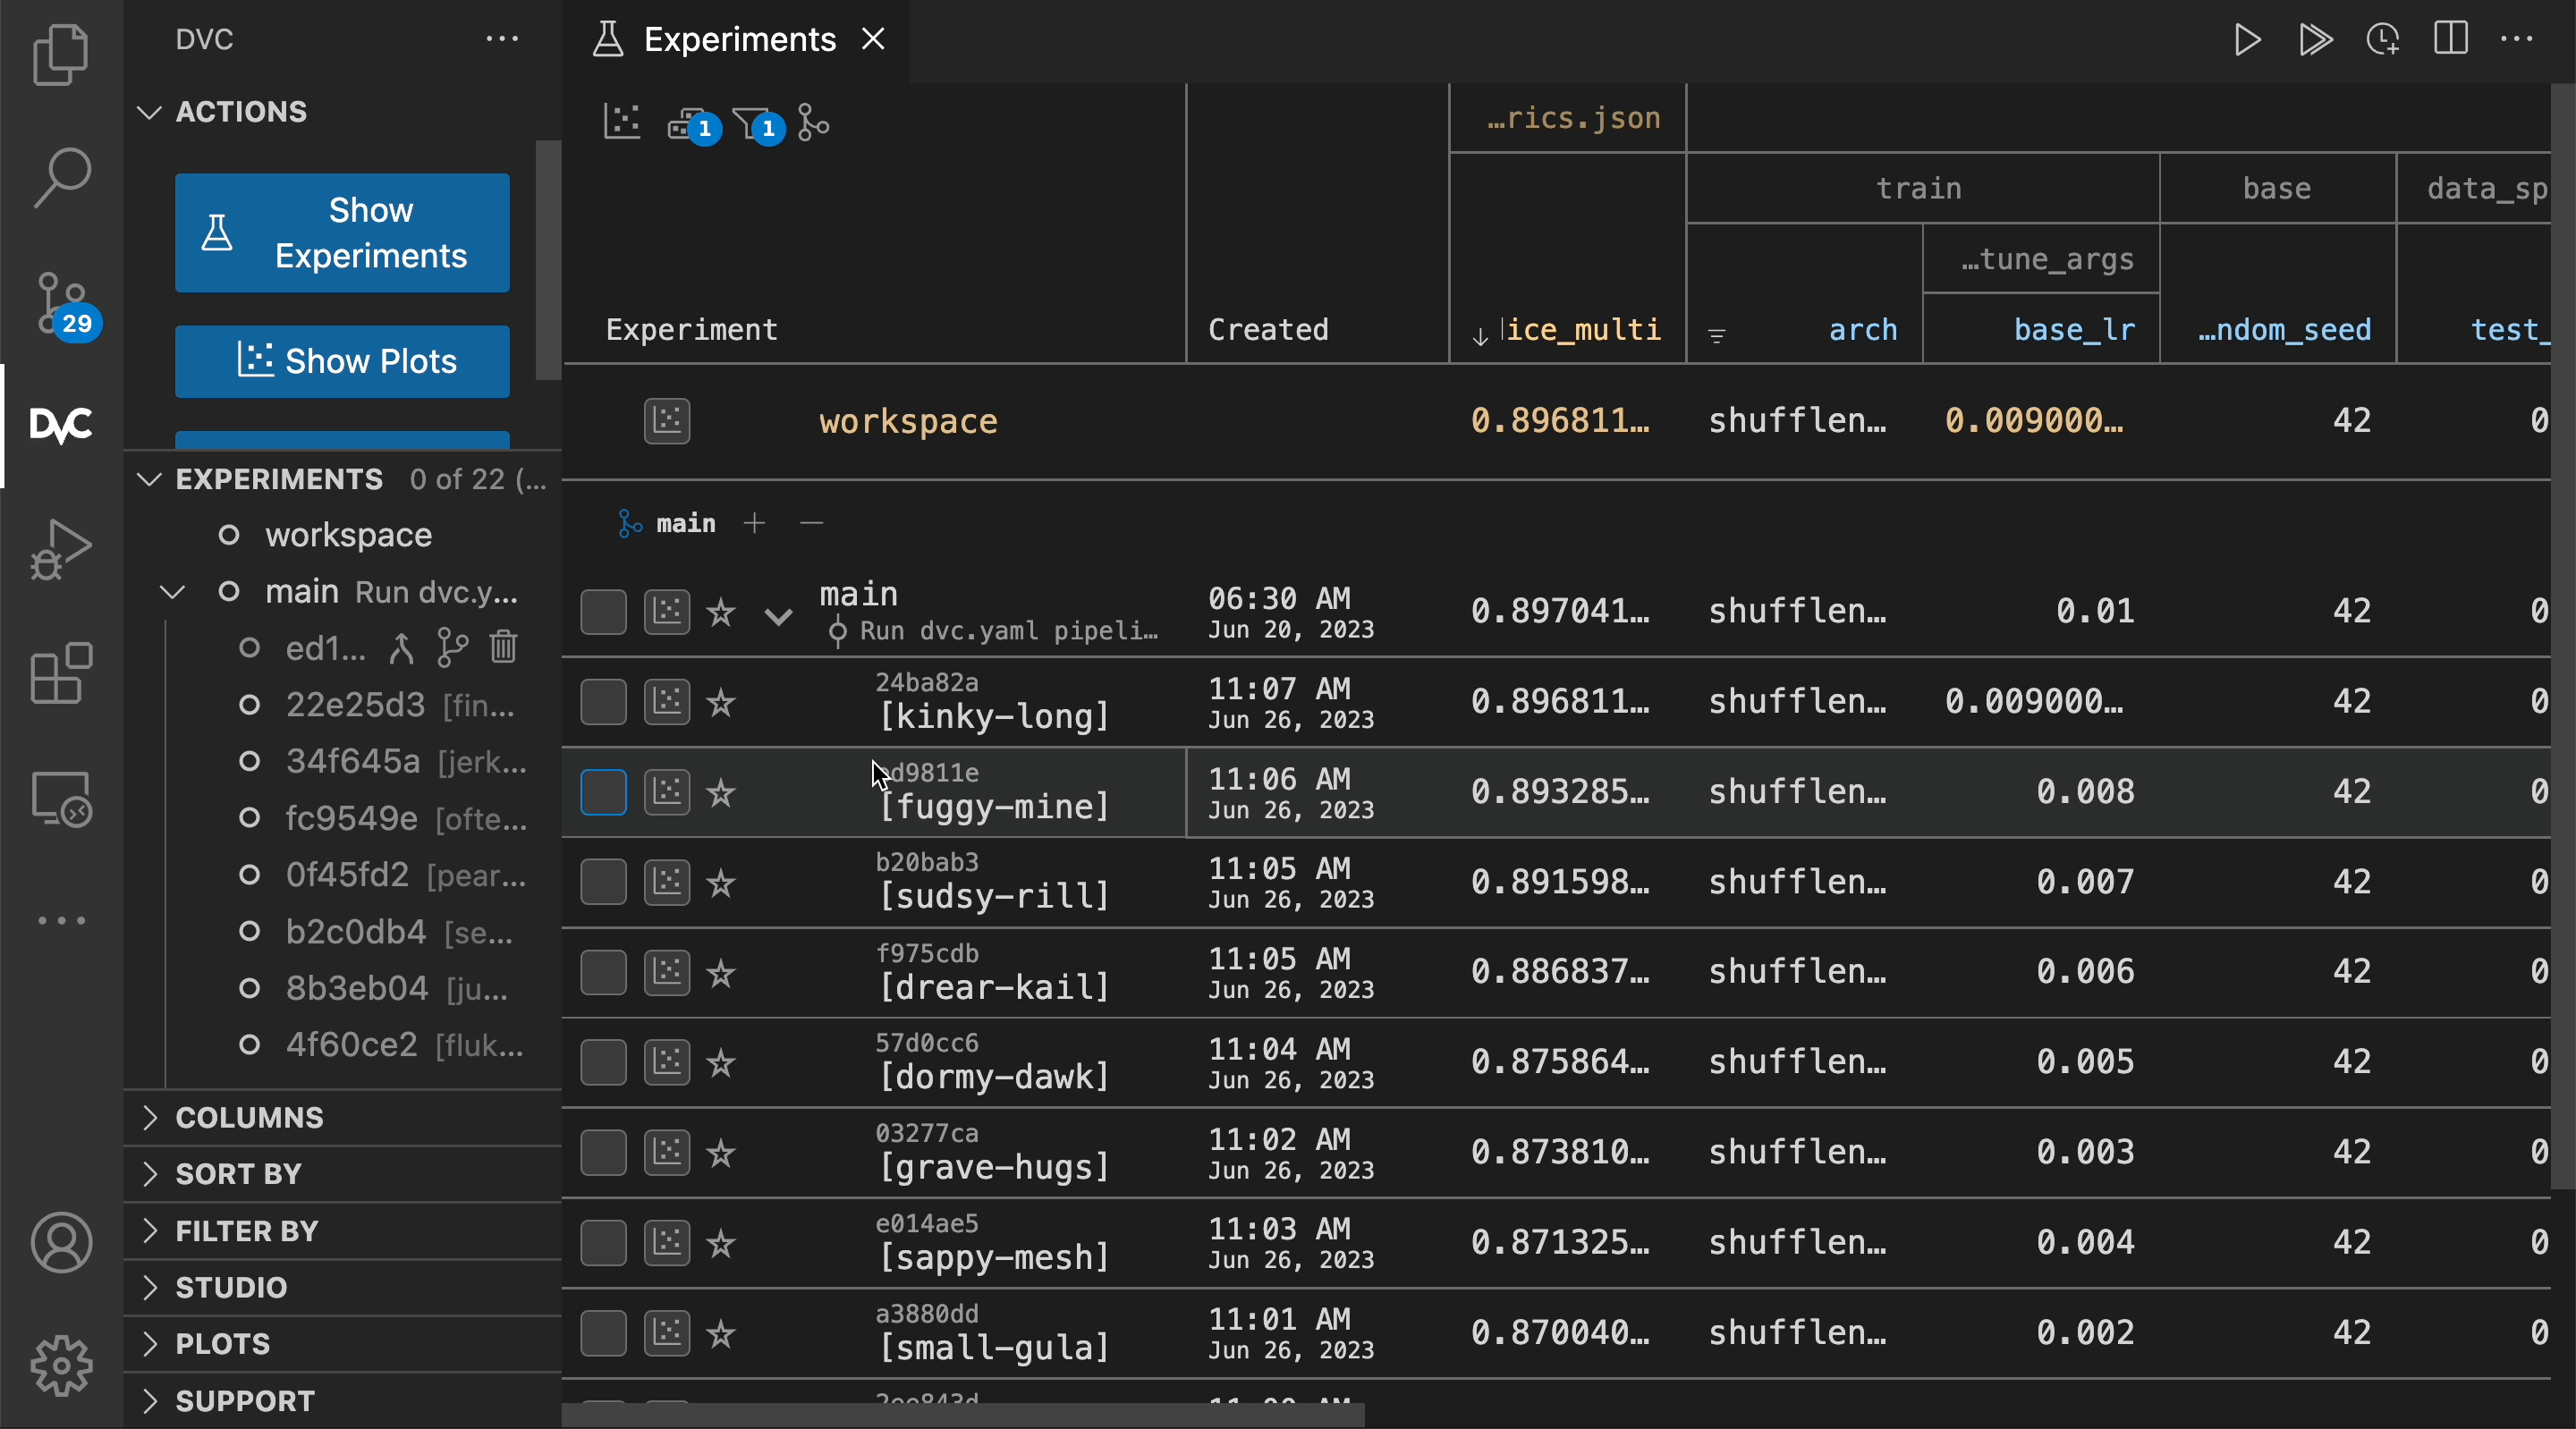
Select the Show Experiments action in the DVC extension for VS Code.
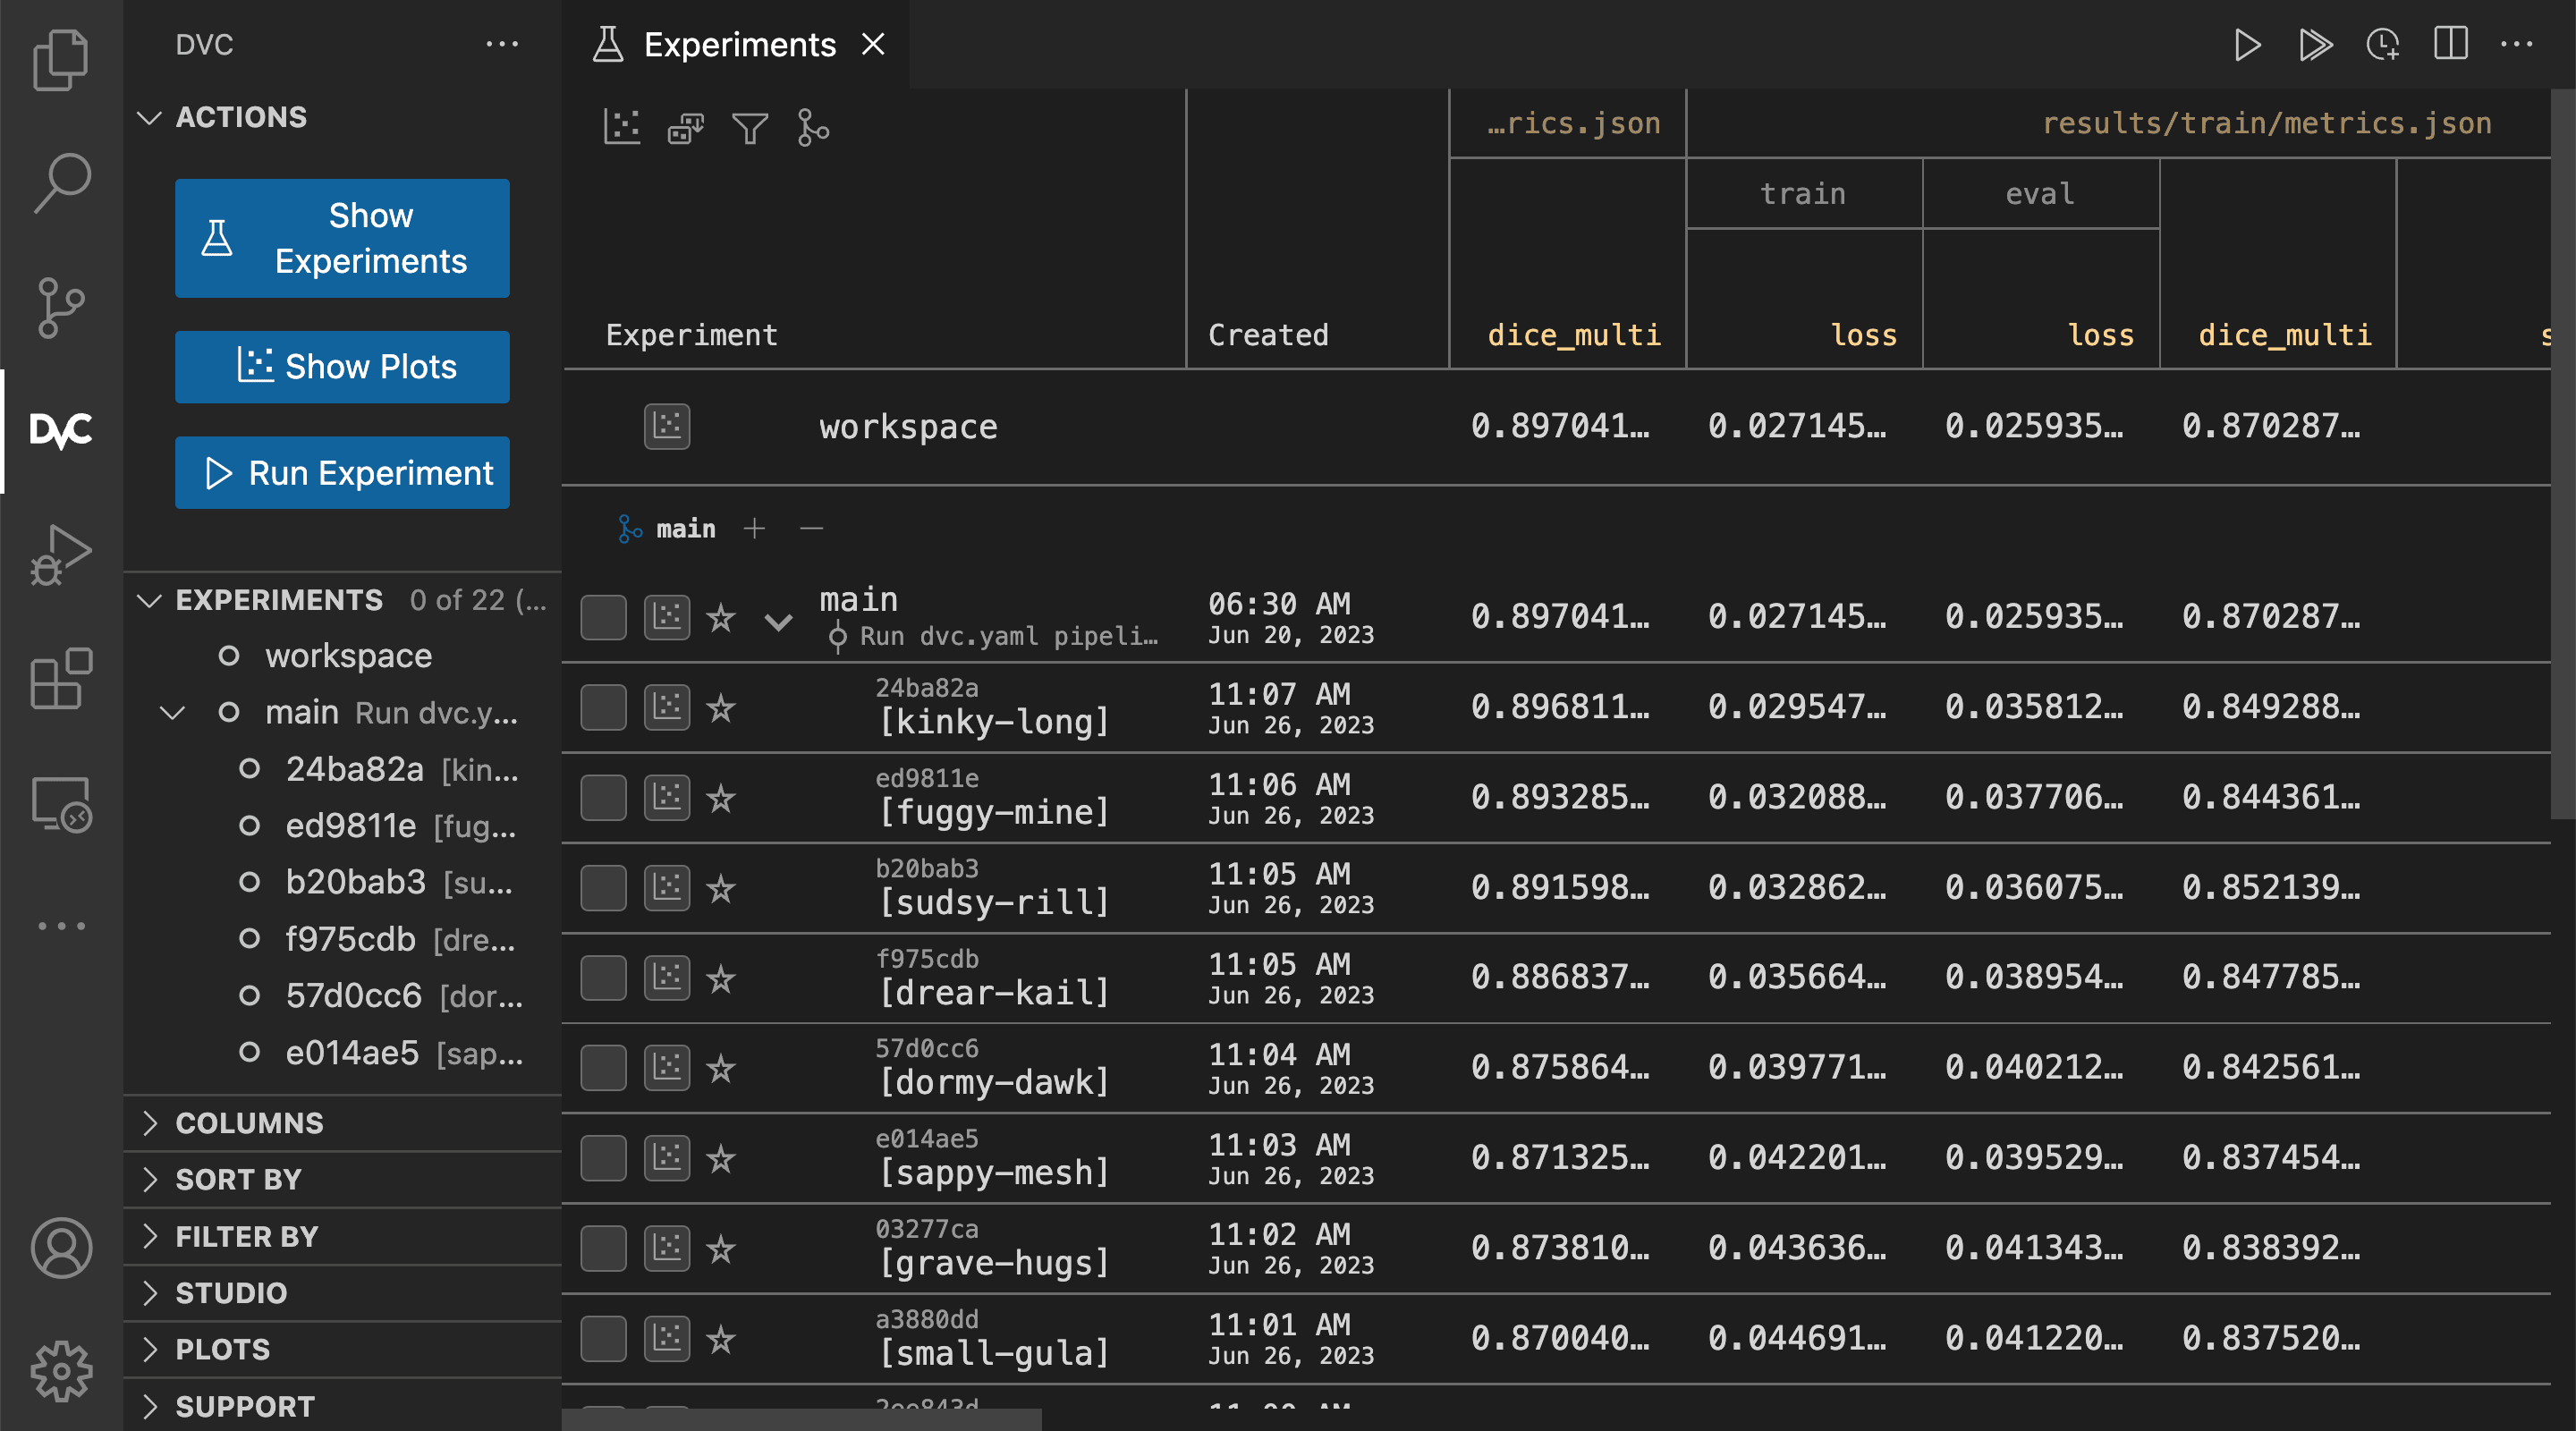
Customize the table of experiments
The table output may become cluttered if you have a large number of metrics, parameters and dependencies. DVC provides several options to select the columns to be shown in the table.
For example, dvc exp show --only-changed will drop any column with values that
do not change across experiments:
$ dvc exp show --only-changed ───────────────────────────────────────────────────────────────────────────────
Experiment Created loss acc model.conv_units
───────────────────────────────────────────────────────────────────────────────
workspace - 0.03332 0.9888 16
baseline-experiment Jan 14, 2022 0.03332 0.9888 16
├── 38d6c53 [cnn-64] Jan 19, 2022 0.038246 0.988 64
└── bc0faf5 [cnn-128] Jan 19, 2022 0.038325 0.989 128
───────────────────────────────────────────────────────────────────────────────See more examples in the
dvc exp show reference for how to
filter columns, sort rows, and otherwise customize the table.
You can hide and move columns and filter rows in the Show Experiments action
in the DVC extension for VS Code.
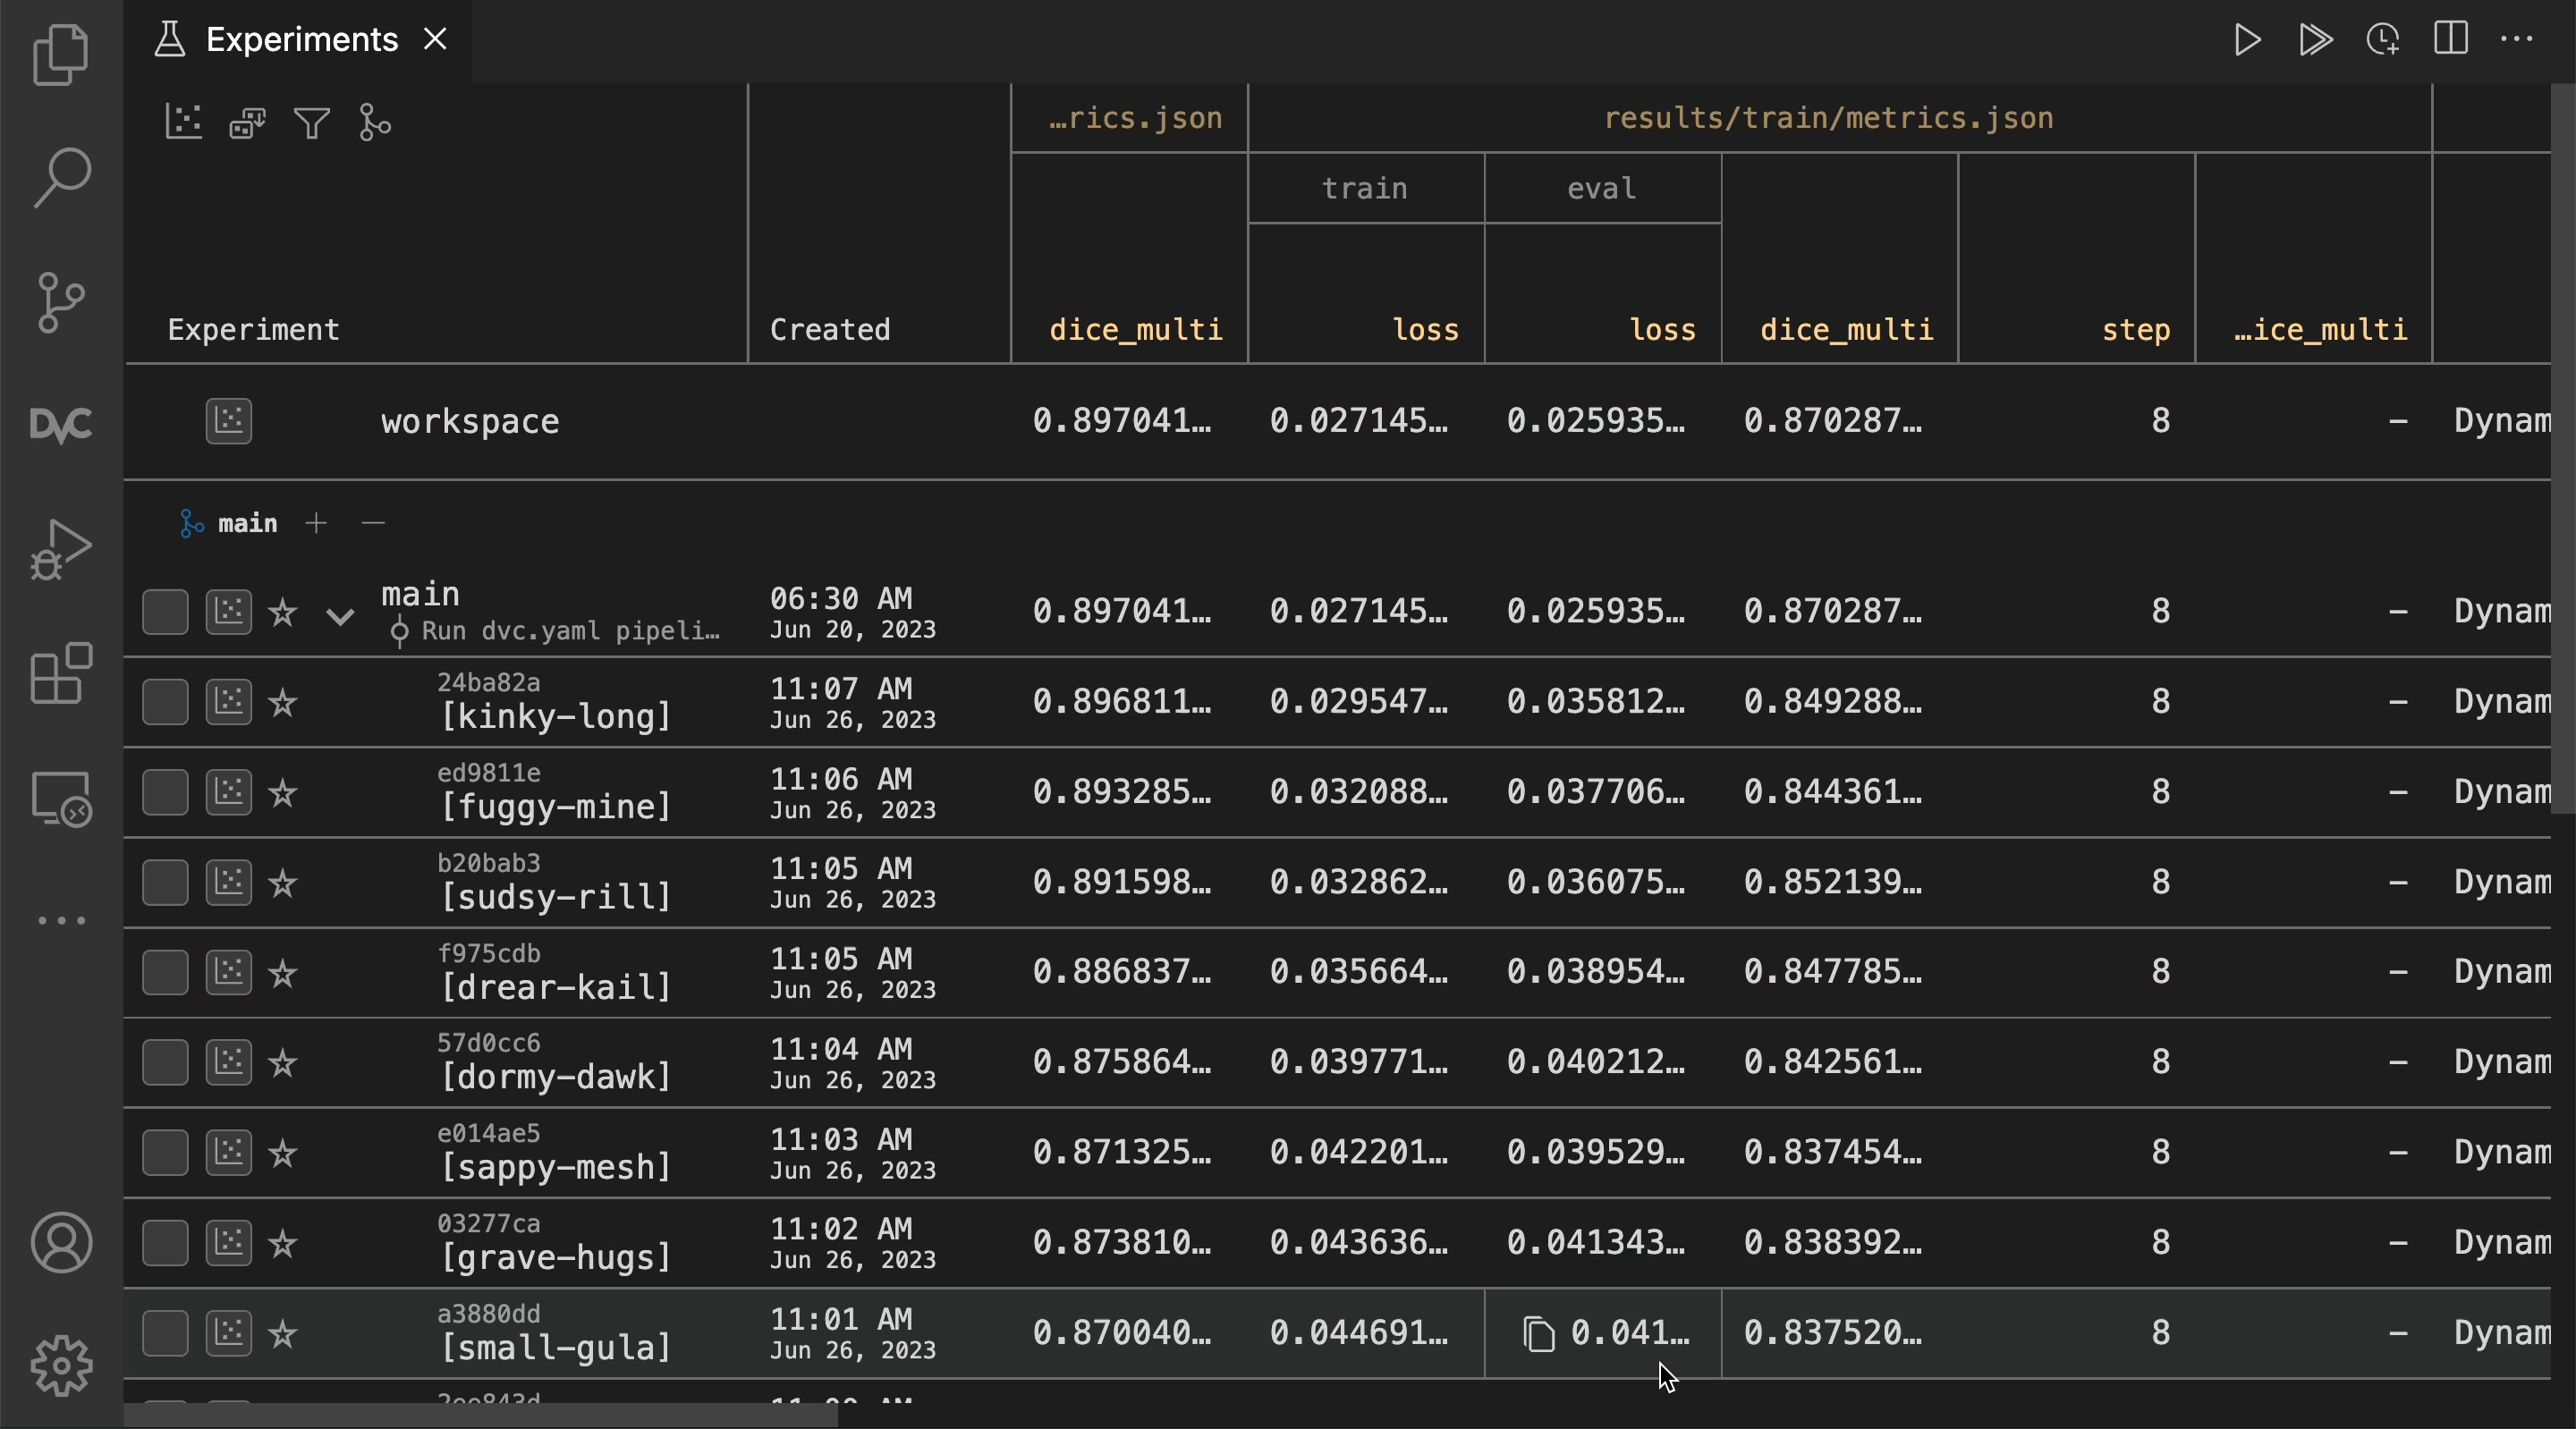
You can also sort both experiment and commit rows in the extension.
Other ways to access the experiments table
If viewing the table isn't enough and you need programmatic access to the experiments table, you can save it as a CSV or access it using the Python API.
dvc exp show can also output the table in CSV, with --csv. It includes all
the data found in the table.
$ dvc exp show --csvExperiment,rev,typ,Created,parent,loss,acc,train.epochs,model.conv_units
,workspace,baseline,,,0.236574187874794,0.9126999974250793,10,16
baseline-experiment,23ceb4a,baseline,2021-09-06T23:38:07,,0.236574187874794,0.9126999974250793,10,16
cnn-64,6d13f33,branch_commit,2021-09-09T13:06:05,,0.2338544875383377,0.9153000116348267,10,64
cnn-128,69503c6,branch_commit,2021-09-09T12:53:51,,0.2324332743883133,0.9160000085830688,10,128For example, let's parse the CSV output with csvkit to get a statistical summary about the experiments:
$ dvc exp show --csv | csvstat
...
7. "acc"

        Type of data:          Number
        Contains null values:  False
        Unique values:         5
        Smallest value:        0.9127
        Largest value:         0.9167
        Sum:                   5.4895
        Mean:                  0.914917
        Median:                0.91565
        StDev:                 0.001774
        Most common values:    0.9127 (2x)
                               0.9167 (1x)
                               0.9153 (1x)
                               0.9161 (1x)
                               0.916 (1x)
...The experiments table is also available in the DVC Python API:
import dvc.api

exps = dvc.api.exp_show()
This returns a list of dictionaries, where each dictionary represents an experiment:
[
  {
    "Experiment": "paled-acre",
    "rev": "883442c",
    "Created": "Apr 19, 2023",
    "dice_multi": 0.8590125166103912,
    "train.arch": "squeezenet1_1"
  },
  {
    "Experiment": "vocal-suer",
    "rev": "231e504",
    "Created": "Apr 19, 2023",
    "dice_multi": 0.8997336177828745,
    "train.arch": "resnet34"
  },
  {
    "Experiment": "banal-hogs",
    "rev": "ff4a08a",
    "Created": "Apr 19, 2023",
    "dice_multi": 0.8758231459806097,
    "train.arch": "alexnet"
  }
]
The format returned by dvc.api.exp_show() can be directly converted to a
Pandas DataFrame:
import dvc.api
import pandas as pd

df = pd.DataFrame(dvc.api.exp_show())
Compare plots
The experiments table compares scalar parameters and metrics. You can also save plots data from each exepriment and overlay plots from different experiments to compare them. Plots can include metrics trends, non-scalar data like ROC curves or histograms, and static images to compare. Get more info on visualizing plots and see the examples below for how to compare plots between experiments.
You can use dvc plots diff to compare plots across experiments. To get the
names of experiments to compare, use dvc exp list --name-only, which will
return the names of all experiments in HEAD. See the options for
dvc exp list to choose a different set of experiments.
$ dvc plots diff $(dvc exp list --name-only)![]()
In the DVC extension for VS Code, select any experiments in the table to plot.
Bring experiment results to your workspace
To inspect an experiment beyond what you can see in the table or plots (like inspecting code or data changes), you can restore a previous experiment's results to your workspace.
⚠️ Conflicting changes in the workspace are overwritten, but they can be recovered.
$ dvc exp apply ochre-dook
Changes for experiment 'ochre-dook' have been applied...You can apply the results of any experiment to the workspace in the DVC extension for VS Code.
You can use standard Git commands (e.g. git add/commit/push) to persist this
experiment directly in the repository. DVC-tracked data and
artifacts are already in the DVC cache, and the rest (params, code and config
files, etc.) can be stored in Git.
Note that you need to
dvc pushin order to share or backup the DVC cache contents.
Compare outside your workspace
The methods above let you compare experiments from your local machine where you are working without any servers, logins, or infrastructure. However, sometimes you are away from your machine, or you want to share the results with others. DVC Studio provides a web collaboration hub for sharing experiments and visualizing and comparing experiments for your entire project history.
Removing experiments
Although DVC uses minimal resources to keep track of the experiments, they may clutter tables and the workspace. When you want to discard experiments by their name, you can remove them.
Use dvc exp remove and supply the experiment name.
$ dvc exp list
main:
    2399f24 [cnn-128]
    4e8a178 [cnn-32]
    f1edf21 [cnn-64]
$ dvc exp remove cnn-32 cnn-64
Removed experiments: cnn-32,cnn-64
See the dvc exp remove options for how to choose sets of multiple experiments
to remove.
You can remove any number of experiments in the DVC extension for VS Code.
Removing an experiment does not delete any objects in the DVC
cache. To remove the cache objects (e.g. model files, intermediate
artifacts, etc.) related with the experiments, you can use dvc gc.