Get Started: Metrics, Plots, and Parameters
DVC makes it easy to track metrics, visualize performance with plots, and update parameters. These concepts are introduced below.
All of the above can be combined into experiments to run and compare many iterations of your ML project.
Collecting metrics and plots
First, let's see the mechanism to capture values for these ML attributes. Add a final evaluation stage to our earlier pipeline:
$ dvc stage add -n evaluate \
  -d src/evaluate.py -d model.pkl -d data/features \
  -o eval \
python src/evaluate.py model.pkl data/featuresdvc stage add will generates this new stage in the dvc.yaml file:
evaluate:
  cmd: python src/evaluate.py model.pkl data/features
  deps:
    - data/features
    - model.pkl
    - src/evaluate.py
  outs:
    - eval
We cache your metrics and plots files with DVC, by making eval directory as a
stage output the same way outputs were added in previous stages. This is the
easiest way to handle this, and if amount of files and size is growing it
doesn't affect your Git history. Alternatively it could be setup in more
granular way to track certain metrics files or plots in Git, while other files
could still be tracked by DVC.
evaluate.py uses DVCLive to write scalar metrics values (e.g. AUC) and
plots data (e.g. ROC curve) to files in the eval directory that DVC can
parse to compare and visualize across iterations. By default, DVCLive will
configure metrics and plots for you in dvc.yaml, but in this example we
customize them by editing dvc.yaml to combine train and test plots.
To combine train and test data, and to set other custom attributes like titles,
first disable DVCLive's default configuration by opening src/evaluate.py,
finding with Live(EVAL_PATH) as live:, and modifying it to
with Live(EVAL_PATH, dvcyaml=False) as live:. Then add the following custom
configuration to dvc.yaml:
metrics:
- eval/metrics.json
plots:
- ROC:
    template: simple
    x: fpr
    y:
      eval/plots/sklearn/roc/train.json: tpr
      eval/plots/sklearn/roc/test.json: tpr
- Confusion-Matrix:
    template: confusion
    x: actual
    y:
      eval/plots/sklearn/cm/train.json: predicted
      eval/plots/sklearn/cm/test.json: predicted
- Precision-Recall:
    template: simple
    x: recall
    y:
      eval/plots/sklearn/prc/train.json: precision
      eval/plots/sklearn/prc/test.json: precision
- eval/plots/images/importance.png
This flexibility to define your own metrics and plots configuration means that you can even generate your own metrics and plots data without using DVCLive!
Let's run and save these changes:
$ dvc repro
$ git add .gitignore dvc.yaml dvc.lock eval
$ git commit -a -m "Create evaluation stage"
Viewing metrics and plots
You can view metrics and plots from the command line, or you can load your project in VS Code and use the DVC Extension to view metrics, plots, and more.
You can view tracked metrics with dvc metrics show :
$ dvc metrics show
Path                    avg_prec.test    avg_prec.train    roc_auc.test    roc_auc.train
eval/metrics.json  0.94496          0.97723           0.96191         0.98737
You can view plots with dvc plots show (shown below), which generates an HTML
file you can open in a browser.
$ dvc plots show
file:///Users/dvc/example-get-started/dvc_plots/index.html


Later we will see how to compare and visualize different pipeline iterations. For now, let's see how to capture another important piece of information which will be useful for comparison: parameters.
Defining stage parameters
It's pretty common for data science pipelines to include configuration files that define adjustable parameters to train a model, do pre-processing, etc. DVC provides a mechanism for stages to depend on the values of specific sections of such a config file (YAML, JSON, TOML, and Python formats are supported).
Luckily, we should already have a stage with
parameters in dvc.yaml:
featurize:
  cmd: python src/featurization.py data/prepared data/features
  deps:
    - data/prepared
    - src/featurization.py
  params:
    - featurize.max_features
    - featurize.ngrams
  outs:
- data/featuresThe featurize stage was created with this dvc stage add command. Notice the
argument sent to the -p option (short for --params):
$ dvc stage add -n featurize \
          -p featurize.max_features,featurize.ngrams \
          -d src/featurization.py -d data/prepared \
          -o data/features \
          python src/featurization.py data/prepared data/features
The params section defines the parameter dependencies of the featurize
stage. By default, DVC reads those values (featurize.max_features and
featurize.ngrams) from a params.yaml file. But as with metrics and plots,
parameter file names and structure can also be user- and case-defined.
Here's the contents of our params.yaml file:
prepare:
  split: 0.20
  seed: 20170428

featurize:
  max_features: 100
  ngrams: 1

train:
  seed: 20170428
  n_est: 50
  min_split: 2
Updating params and iterating
We are definitely not happy with the AUC value we got so far! Let's edit the
params.yaml file to use bigrams and increase the number of features:
 featurize:
-  max_features: 100
-  ngrams: 1
+  max_features: 200
+  ngrams: 2
The beauty of dvc.yaml is that all you need to do now is run:
$ dvc reproIt'll analyze the changes, use existing results from the run cache, and execute only the commands needed to produce new results (model, metrics, plots).
The same logic applies to other possible adjustments — edit source code, update
datasets — you do the changes, use dvc repro, and DVC runs what needs to be
run.
Comparing iterations
Finally, let's see how the updates improved performance. DVC has a few commands to see changes in and visualize metrics, parameters, and plots. These commands can work for one or across multiple pipeline iteration(s). Let's compare the current "bigrams" run with the last committed "baseline" iteration:
$ dvc params diff
Path         Param                   HEAD  workspace
params.yaml  featurize.max_features  100   200
params.yaml  featurize.ngrams        1     2
dvc params diff can show how params in the workspace differ vs. the last
commit.
dvc metrics diff does the same for metrics:
$ dvc metrics diff
Path Metric HEAD workspace Change
eval/metrics.json avg_prec.test 0.9014 0.925 0.0236
eval/metrics.json avg_prec.train 0.95704 0.97437 0.01733
eval/metrics.json roc_auc.test 0.93196 0.94602 0.01406
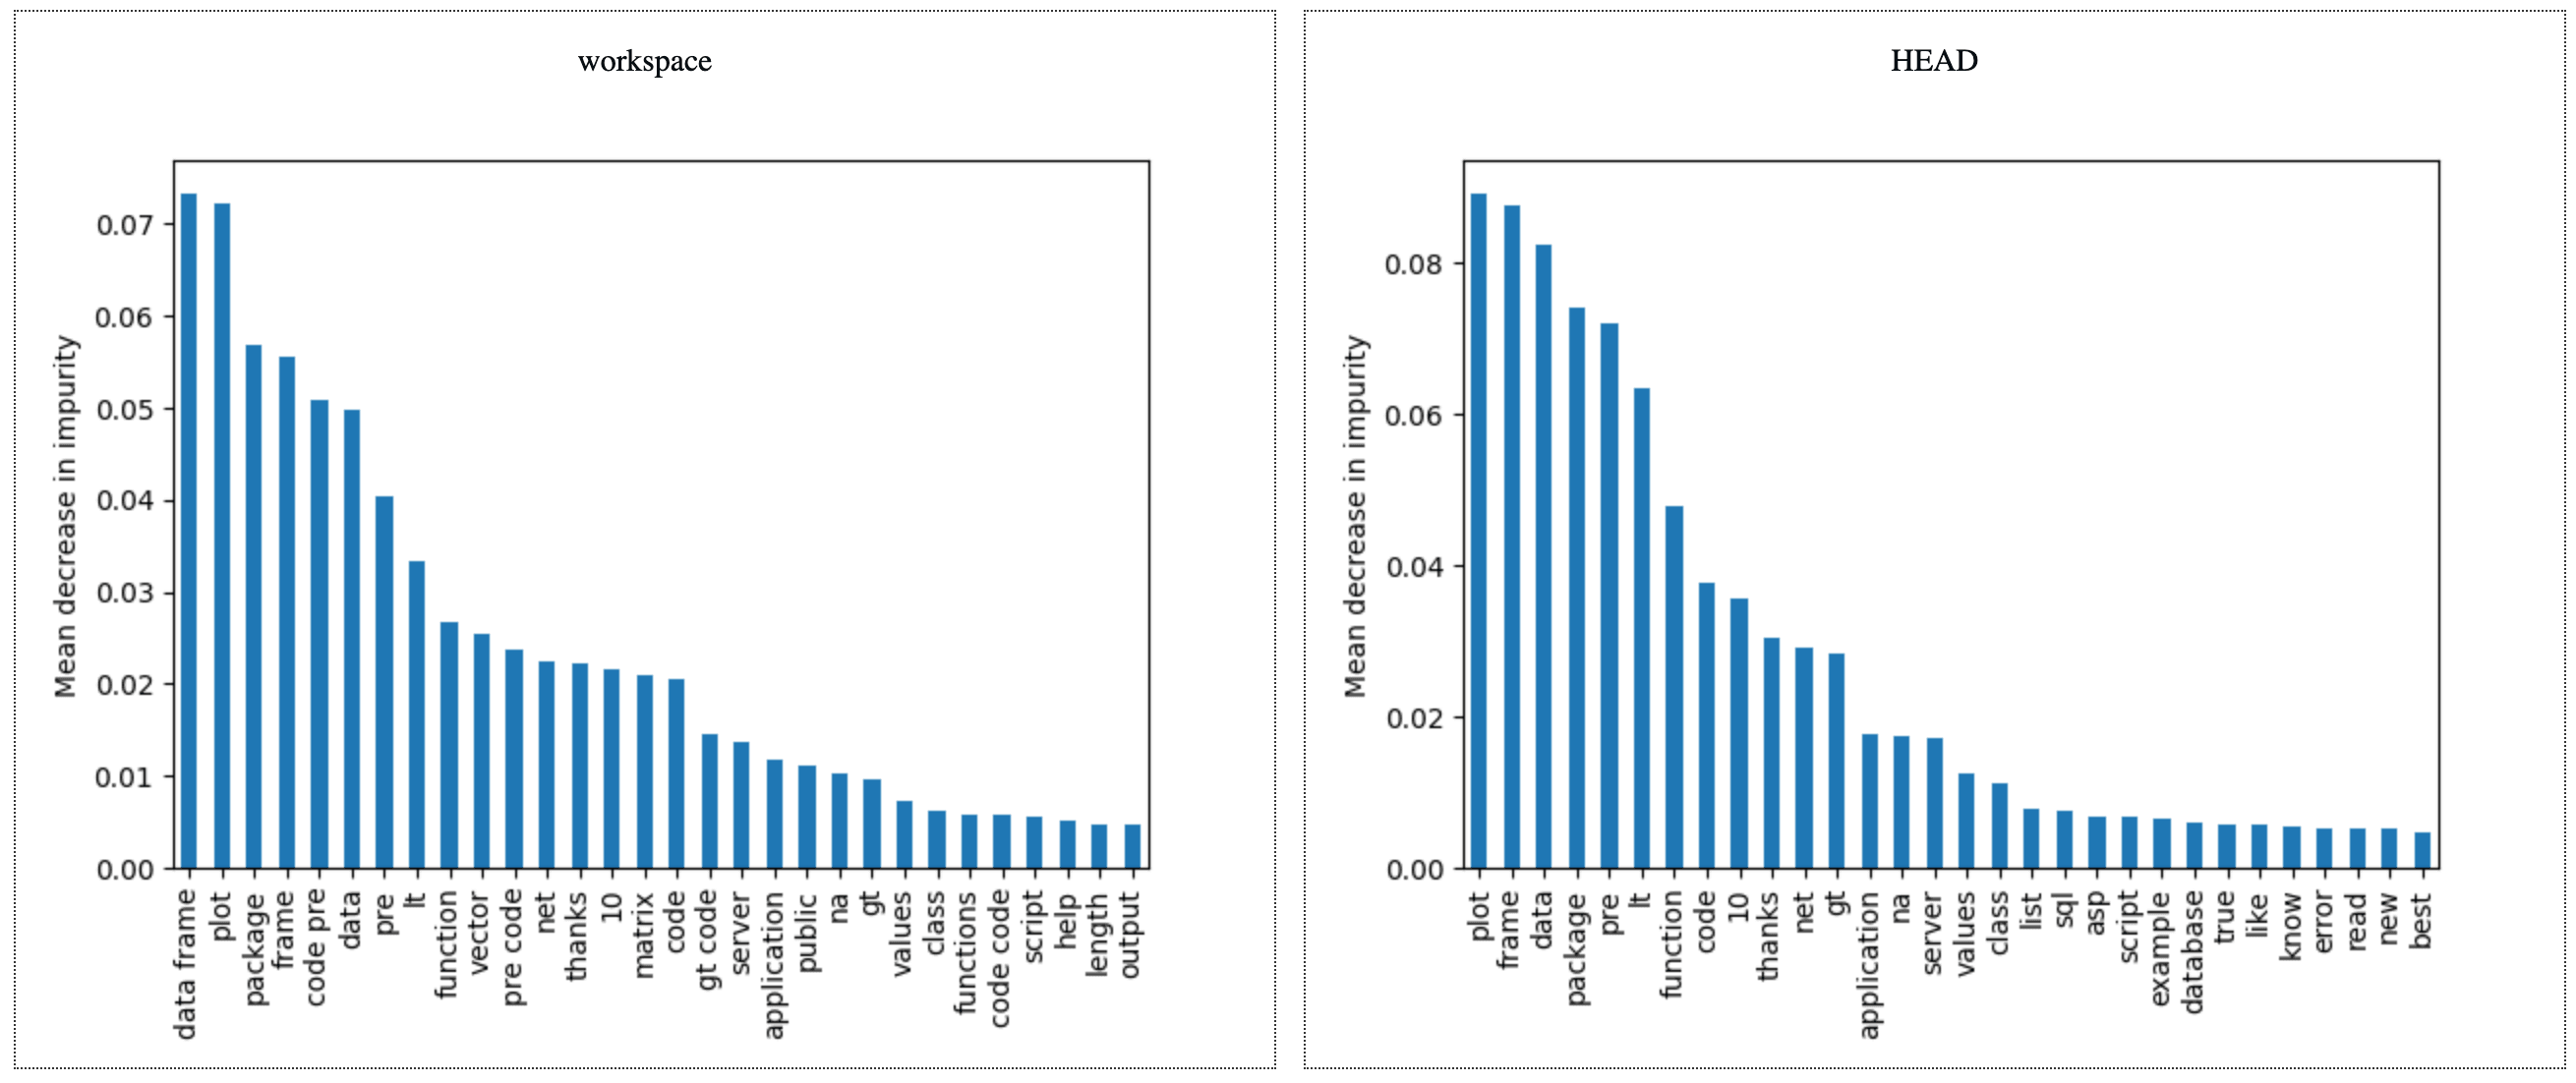
eval/metrics.json roc_auc.train 0.97743 0.98667 0.00924And finally, we can compare all plots with a single command (we show only some of them for simplicity):
$ dvc plots diff
file:///Users/dvc/example-get-started/plots.html
See
dvc plots difffor more info on its options.
All these commands also accept Git revisions (commits, tags, branch names) to compare.