Get Started: Experiment Tracking
Tools like Jupyter Notebooks are useful for rapid prototyping, but it's hard to keep track of changes and reproduce experiments. You can start using DVC to version your experiments without leaving your Jupyter Notebook. Every DVC experiment will be versioned without cluttering your repo, unlike saving each run to a separate directory or creating a Git branch for each.
Running
All you need to start is a DVC repository and the DVCLive Python library installed:
$ pip install dvcliveIn your Python code, you can start versioning your experiments in DVCLive's
Live API or framework-specific callbacks.
There are some examples below (other frameworks available):
from dvclive import Live
from dvclive.lightning import DVCLiveLogger

...
    trainer = Trainer(
        logger=DVCLiveLogger(log_model=True)
    )
trainer.fit(model)from dvclive import Live
from dvclive.huggingface import DVCLiveCallback
...
with Live() as live:
trainer.add_callback(
DVCLiveCallback(live=live)
)
trainer.train()
trainer.save_model("mymodel")
live.log_artifact("mymodel", type="model")from dvclive import Live
from dvclive.keras import DVCLiveCallback
...
with Live() as live:
model.fit(
train_dataset,
validation_data=validation_dataset,
callbacks=[
DVCLiveCallback(live=live)
]
)
model.save("mymodel")
live.log_artifact("mymodel", type="model")from dvclive import Live
with Live() as live:
live.log_param("epochs", NUM_EPOCHS)
for epoch in range(NUM_EPOCHS):
train_model(...)
metrics = evaluate_model(...)
for metric_name, value in metrics.items():
live.log_metric(metric_name, value)
live.next_step()
live.log_artifact("model.pkl", type="model")After this, each execution of the code will create a DVC experiment containing the results and the changes needed to reproduce it.
DVCLive will automatically log some metrics, parameters and plots from the ML
Framework and any
data tracked by DVC but you can
also log additional info to be included in the
experiment. live.log_artifact("mymodel", type="model") will
track your model with DVC and enable managing
it with the model registry.
Learn more about how DVCLive works
Sharing
You can start tracking experiments on your local machine, but often you will want to share results with others or back them up. Optionally follow this section to share, or skip to the next section if you want to start locally.
DVC tracks the code and metadata for each experiment in Git. If you have a Git
remote (for example, GitHub) where you git push, go to DVC Studio, configure
your Git provider, and
add your Git repository as a project.
Next, you can login to Studio from the command line:
$ dvc studio loginOnce configured, DVC Studio will provide realtime updates for all running experiments. Experiment results will also be pushed to your Git and DVC remotes so anyone can recover the entire state of your experiment.
Learn more about how experiment sharing works.
Tracking
By following the steps above, you enable different options to monitor the training progress:
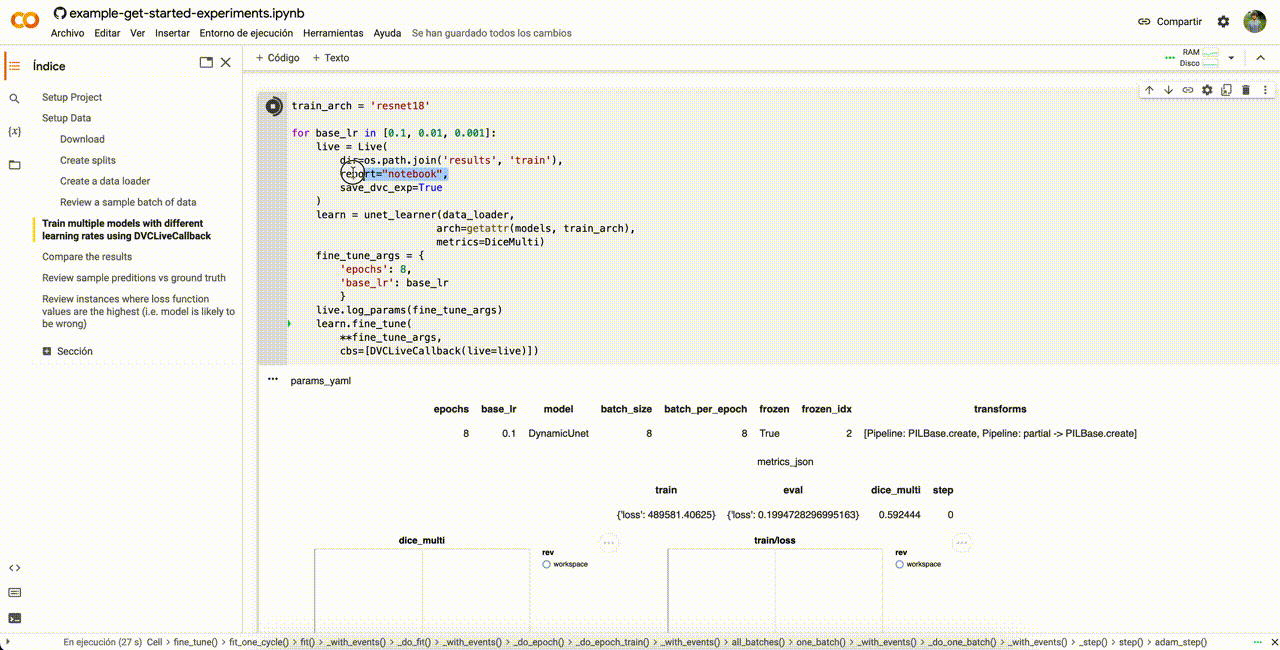
By default, DVCLive will generate or update a report displaying all the logged data.
If you pass report="notebook" to DVCLive, the report will be displayed and
updated inside the output of the cell:
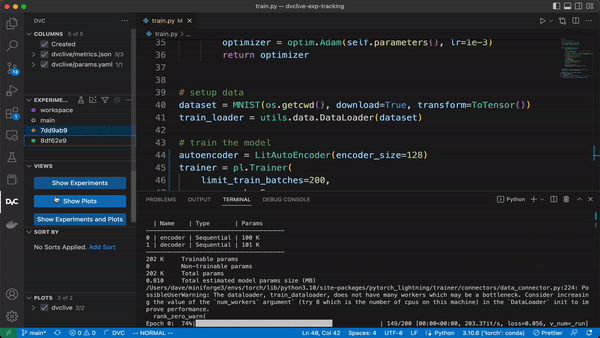
The DVC Extension for VS Code will also display all the data logged by DVCLive:
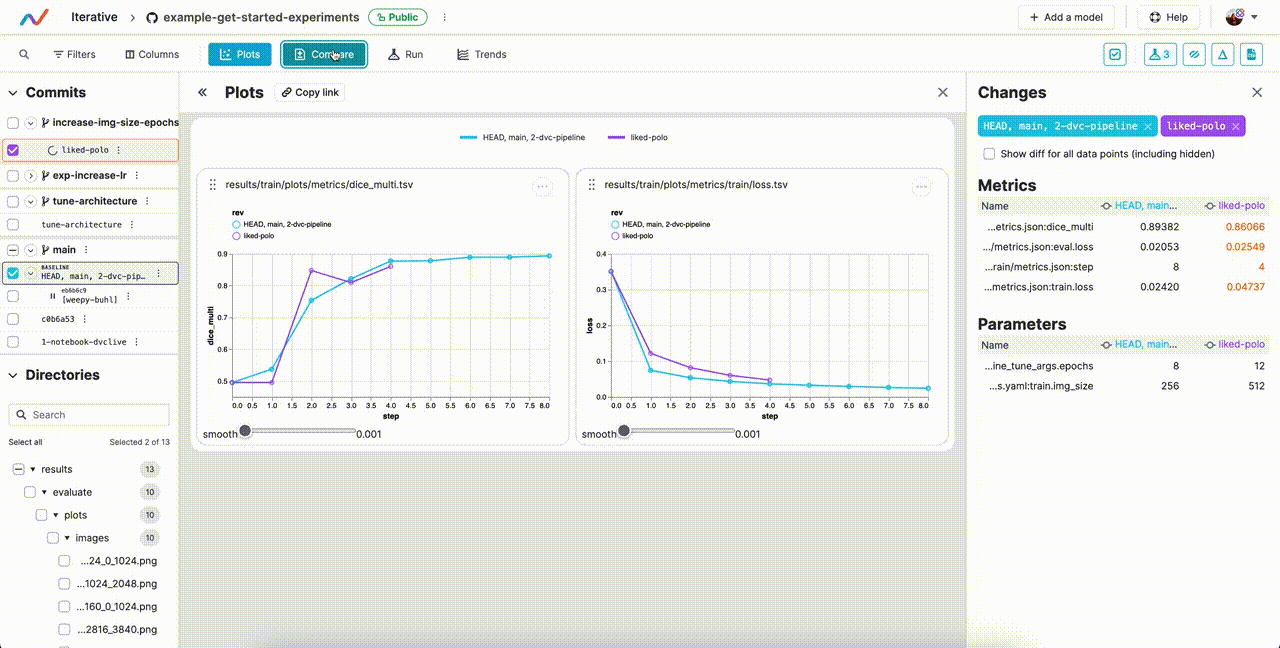
If you followed the instructions above in Sharing, you will see updates in the DVC Studio web interface:
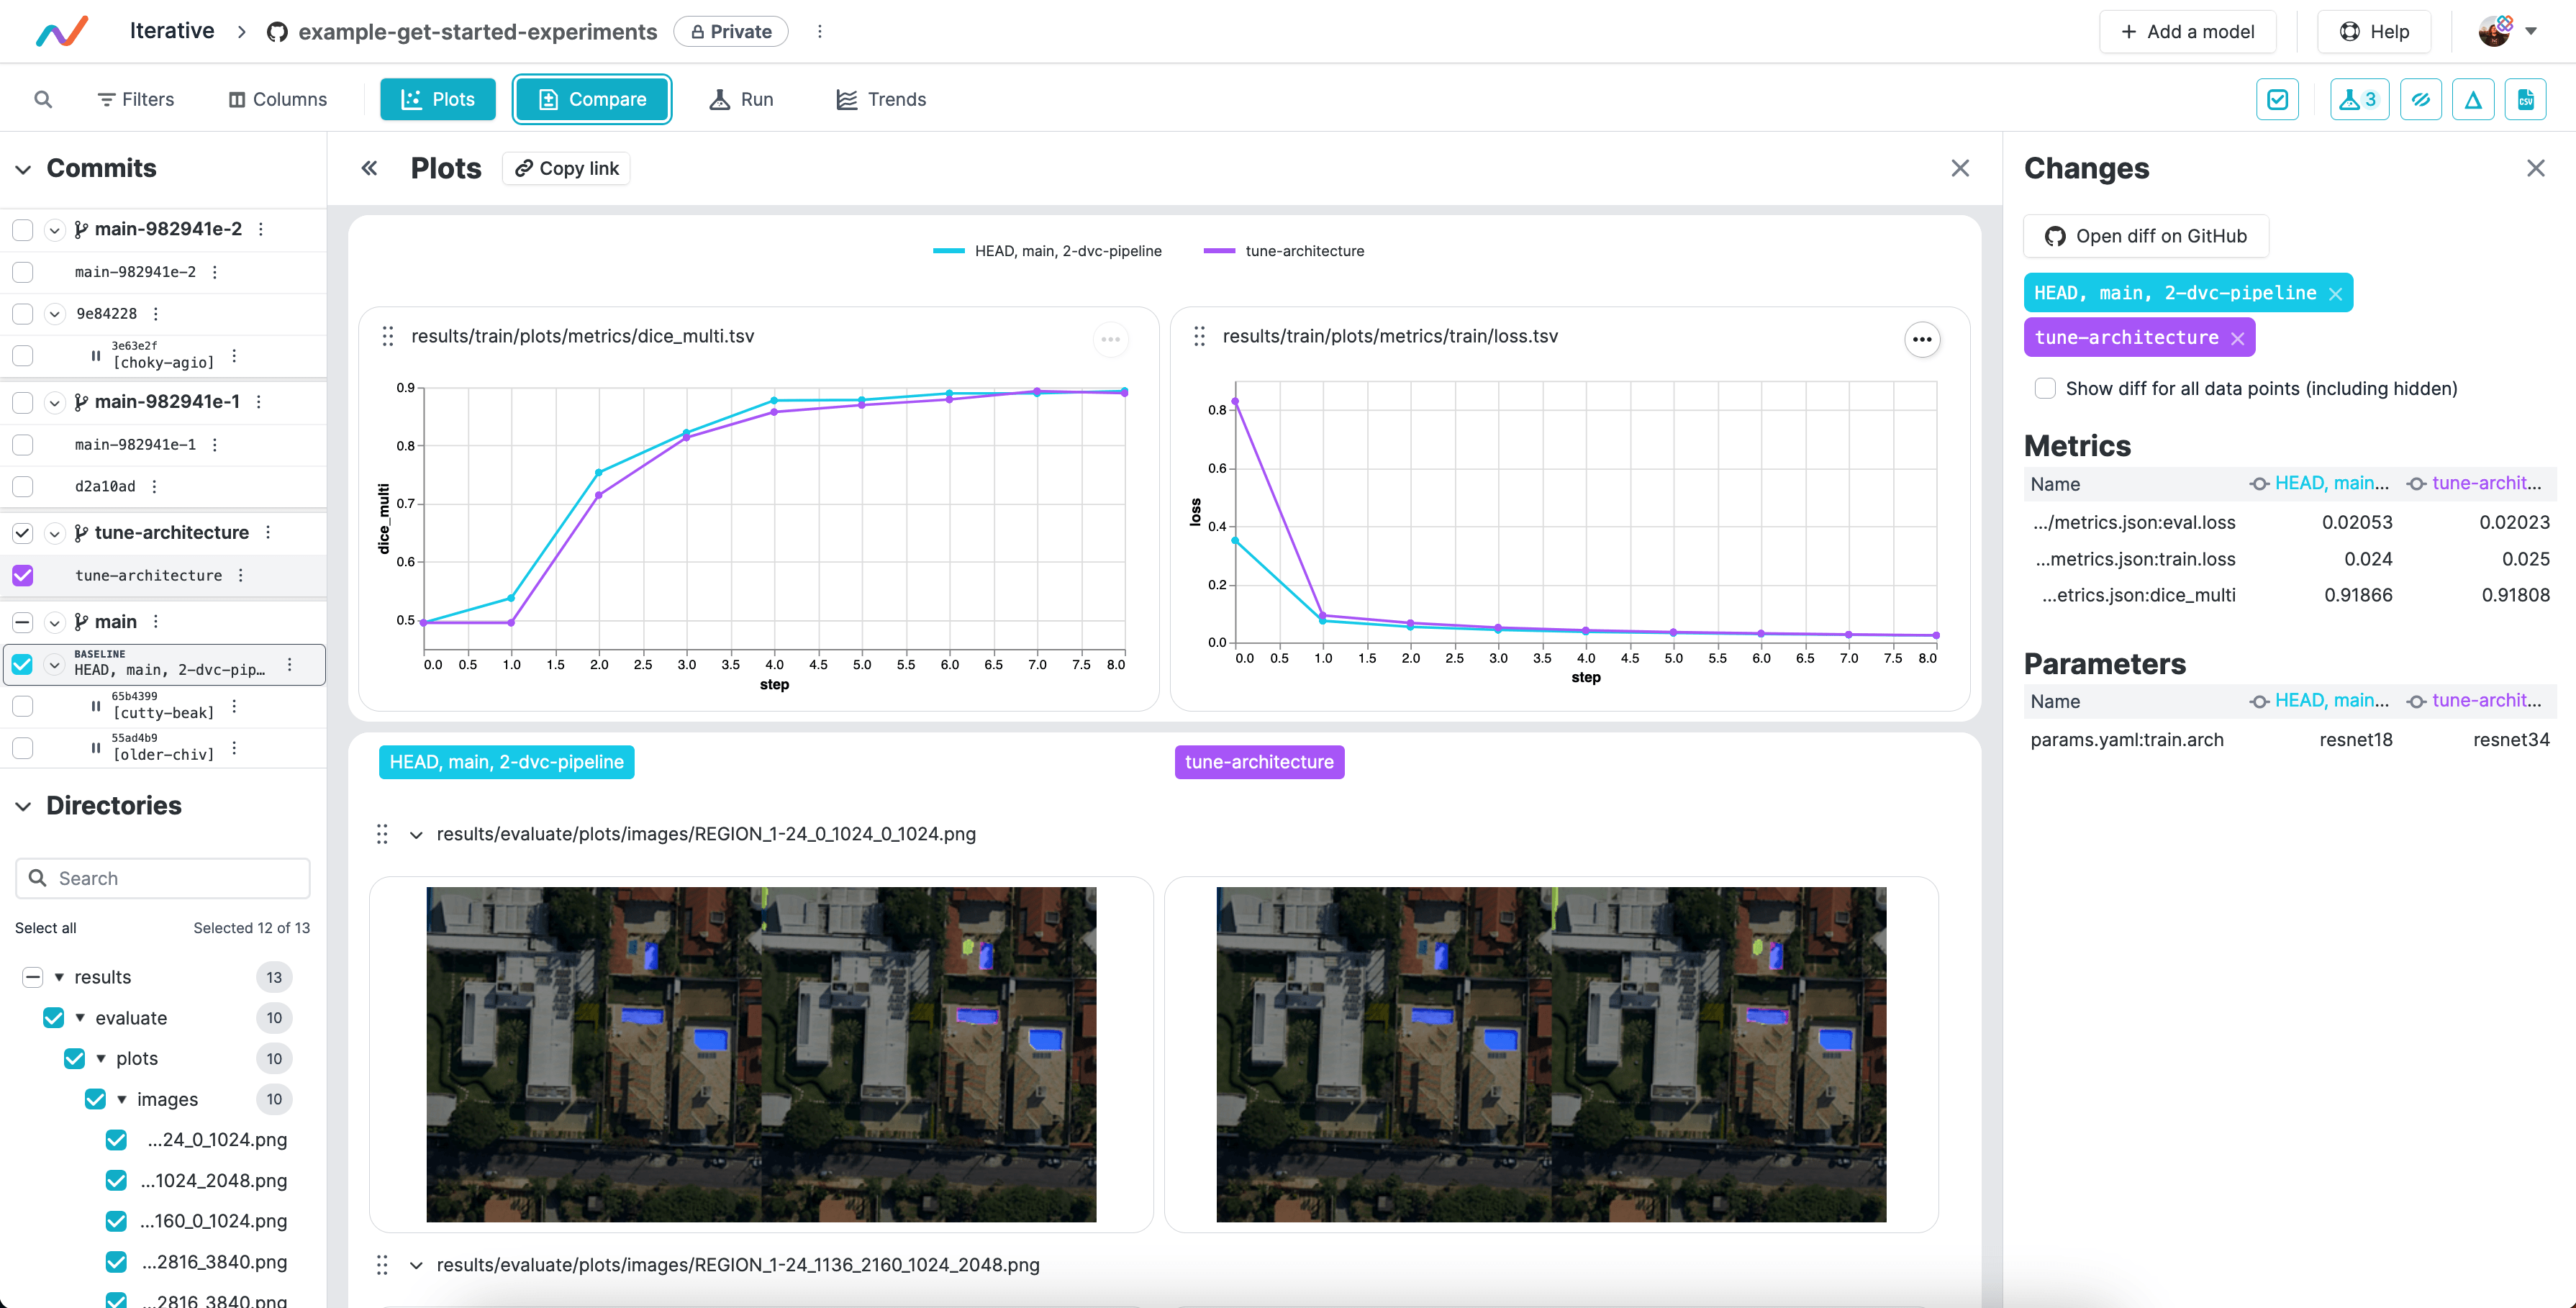
Comparing
After you have run multiple experiments, you can compare the results:
You can use dvc exp show and dvc plots to compare and visualize metrics,
parameters and plots across experiments.
$ dvc exp show
─────────────────────────────────────────────────────────────────────────────────────
Experiment                 Created    train.loss   eval.loss   dice_multi   base_lr
─────────────────────────────────────────────────────────────────────────────────────
workspace                  -            0.024942    0.013983        0.922   0.001
master                     05:26 PM      0.78426    0.054157      0.49599   0.1
├── 950c3b5 [bifid-says]   05:33 PM     0.024942    0.013983        0.922   0.001
├── 06090d7 [potty-sash]   05:31 PM     0.026193    0.015237      0.91494   0.01
└── d1ad0a9 [soupy-leak]   05:28 PM     0.075223    0.034786      0.49596   0.1
─────────────────────────────────────────────────────────────────────────────────────
$ dvc plots diff $(dvc exp list --name-only)![]()
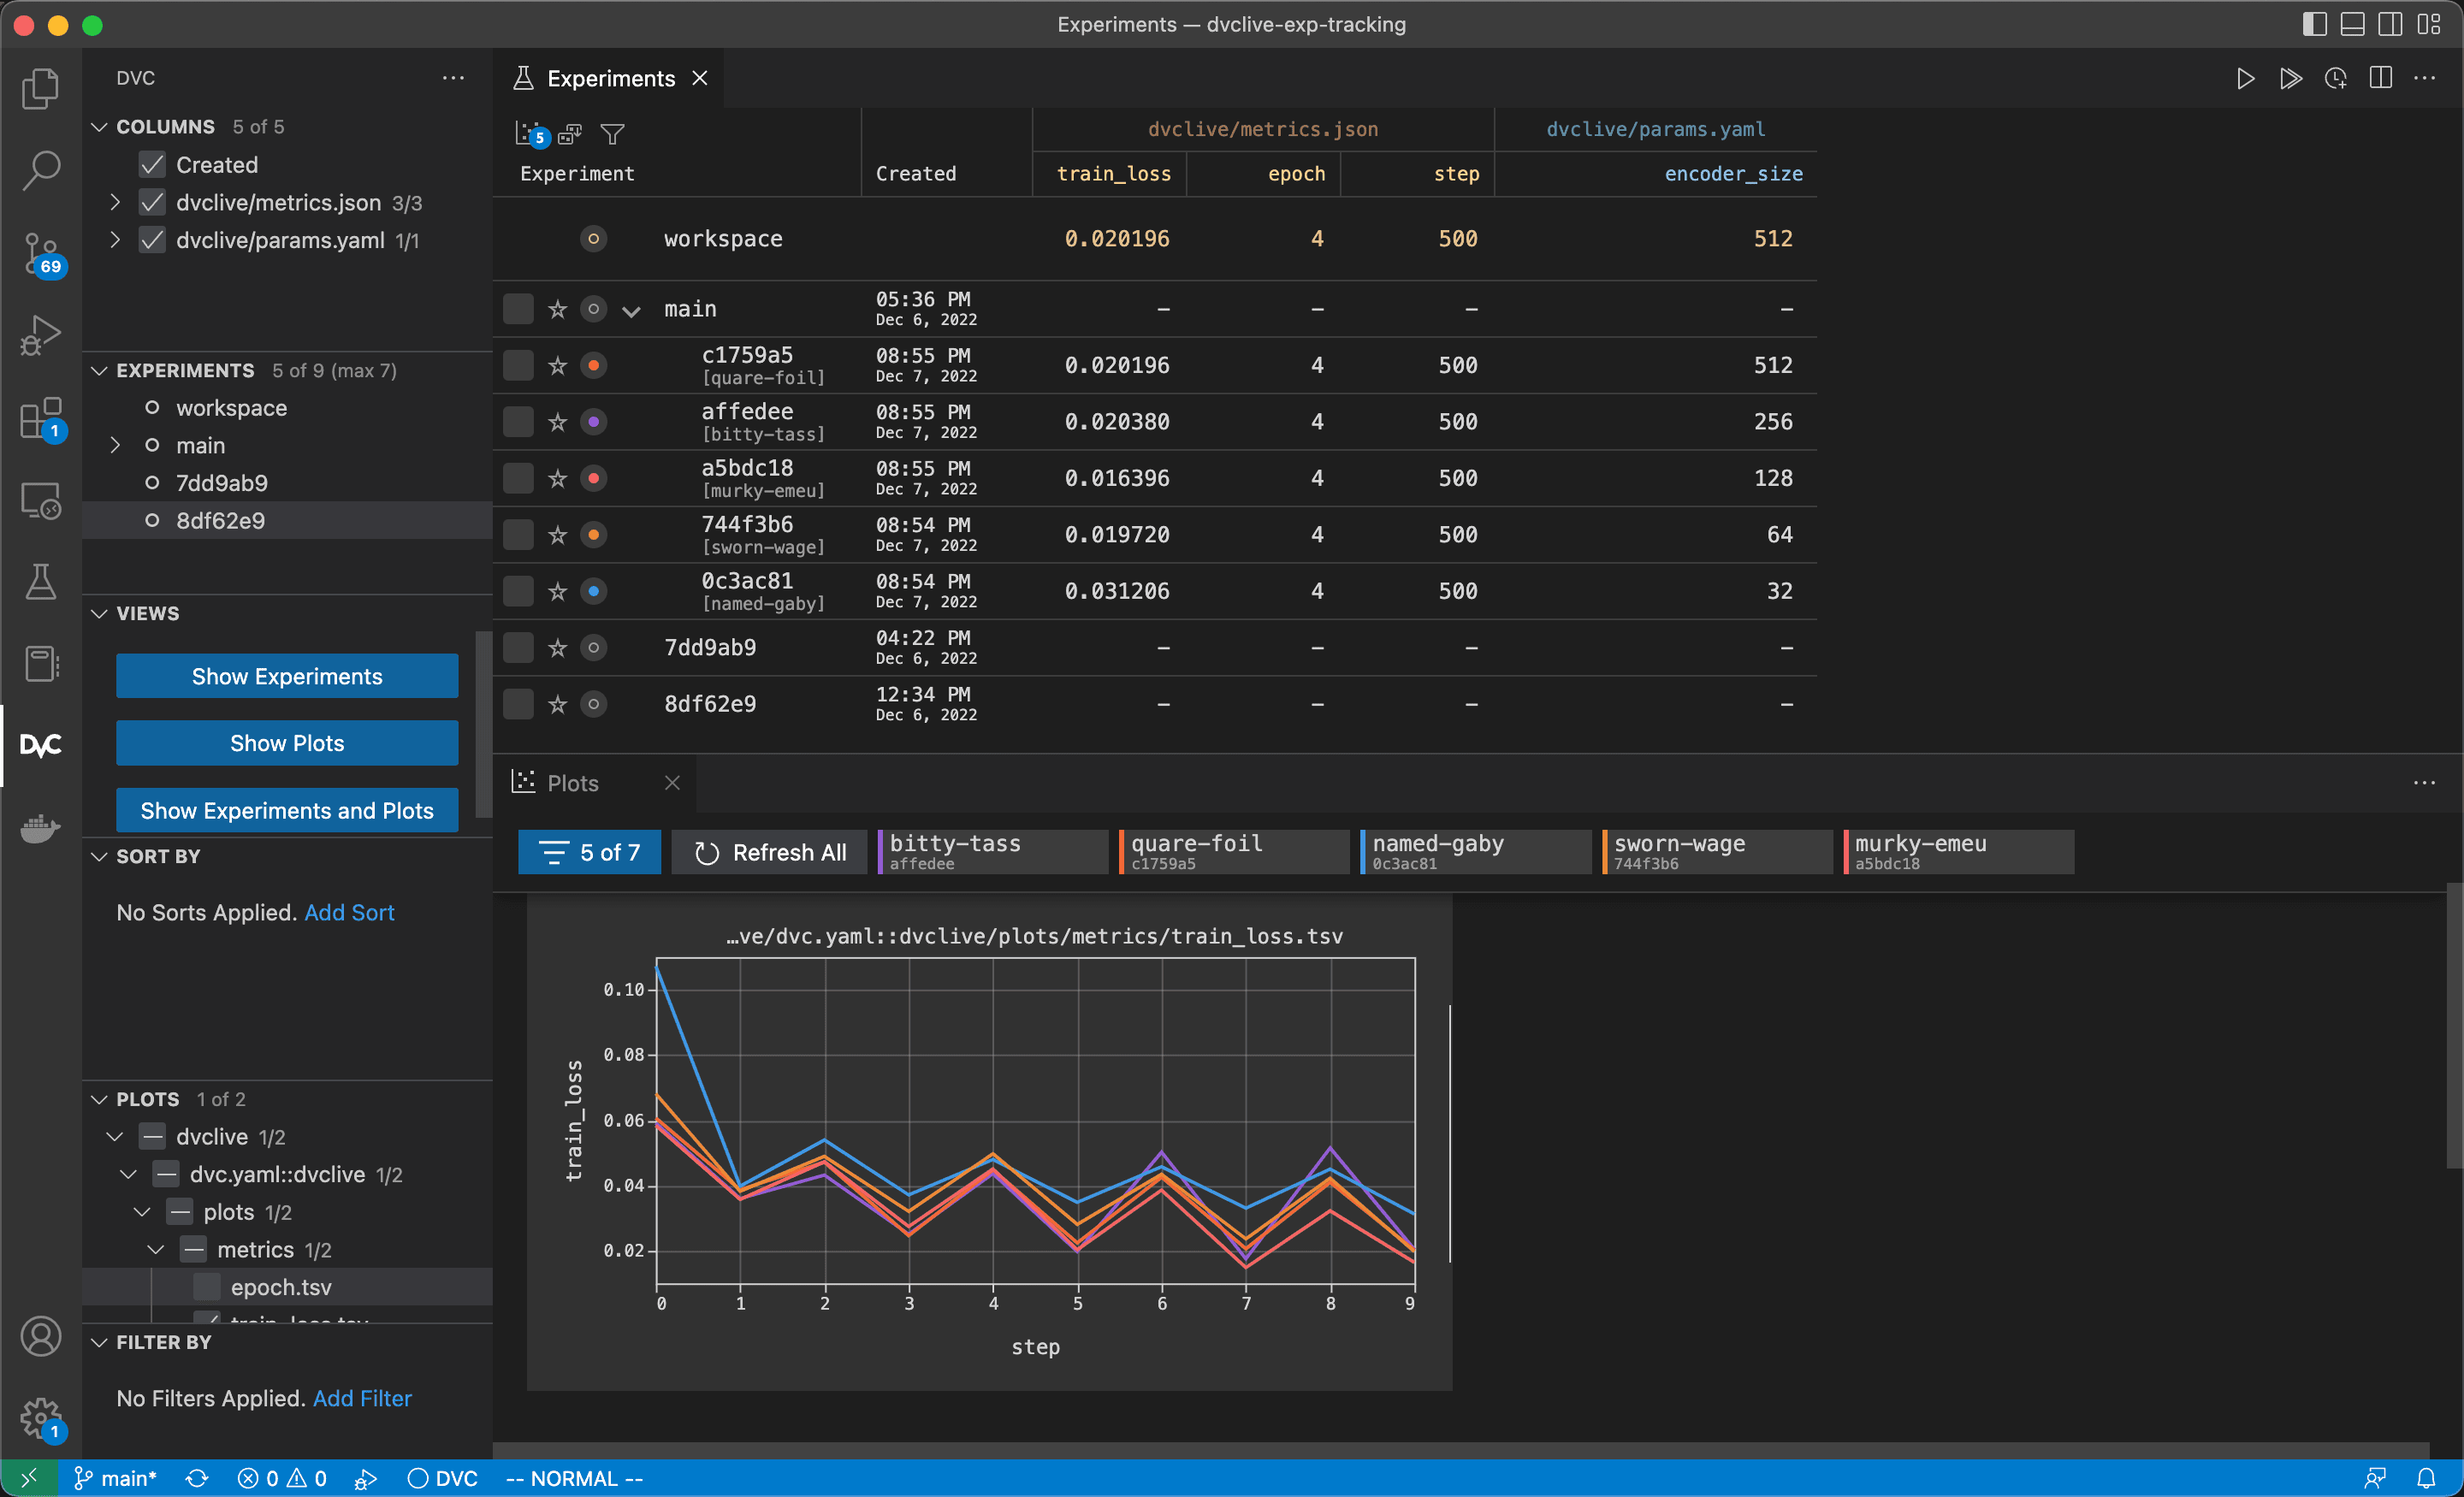
Inside the
DVC Extension for VS Code,
you can compare and visualize results using the
Experiments
and
Plots
views.
If you followed the instructions above in Sharing, you can compare experiments against the entire repo history:
Learn more about Comparing Experiments